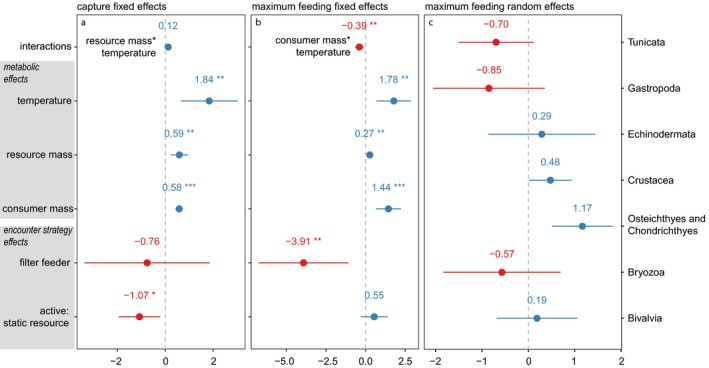
Figure 4.

Mixed effects model predictions for lowest scoring capture and maximum feeding rate models. Fixed effects structures for these models are: (a) capture ~ consumer mass + resource mass * temperature + encounter strategy, and; (b) maximum feeding ~ consumer mass * temperature + resource mass + encounter strategy. Red points are below group intercept coefficients, blue points are above, and bars are 95% confidence intervals. In (a) and (b) stars denote significance: *p < 0.05, **p < 0.01, ***p < 0.001. Taxonomic grouping random effects for maximum feeding rates are shown in (c). Taxonomic grouping random effects for capture rates all intersect with the group intercept. Plots produced with the R package sjPlot (Lüdecke 2017).
