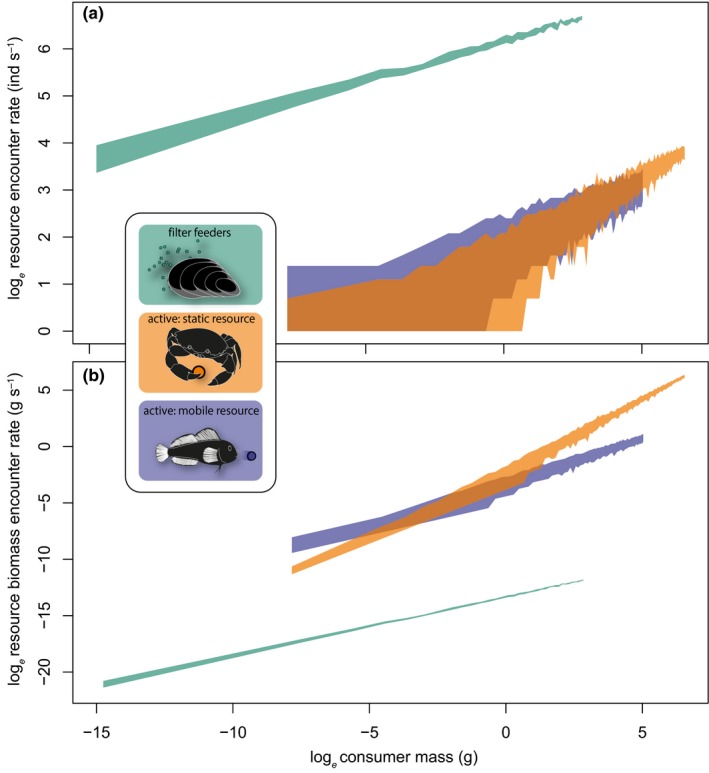
Figure 5.

Agent‐based model outputs of resource encounter rates among encounter strategies (inset) for (a) resource units in individuals s−1 and (b) resource biomass in g s−1. Shaded areas are interpolated 0.025 (lower) and 0.975 (upper) quantiles (n = 1000) of encounters along the consumer mass axis. The model is empirically parameterised with respect to consumer masses, resource masses and resource densities (Figs S3 and S4) underpinning the meta‐analysis (Figs 3 and 4).
