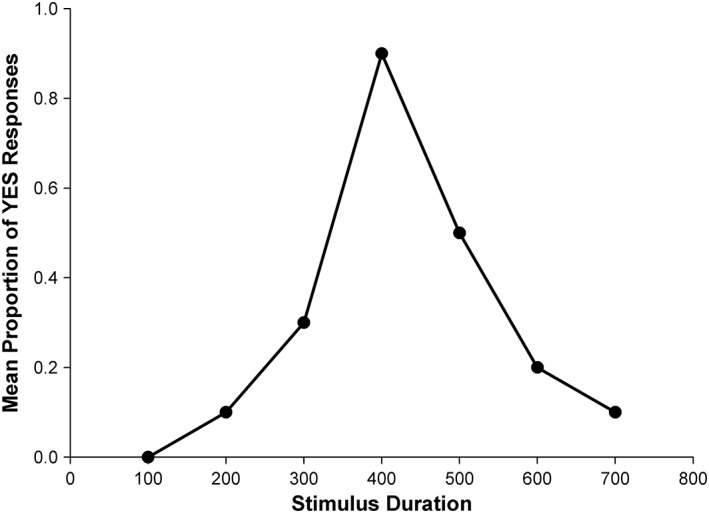
Figure 6.

Typical temporal generalization function plotted where the maximum number of “yes” responses typically occurs when the comparison is identical to the standard duration, and decreases as the difference between them increases. The steepness of this function gives a measure of temporal sensitivity, and because comparisons both longer and shorter than the Standard are presented, the function allows for the identification of distortion or asymmetry in responding. These functions are typically slightly asymmetrical in normal adults, with more YES responses to comparisons longer than the standard than for comparisons that are shorter; i.e., adult have a slight tendency to confuse durations that are longer than standard with the standard more than durations that are shorter (see Wearden [1992] for full discussion).
