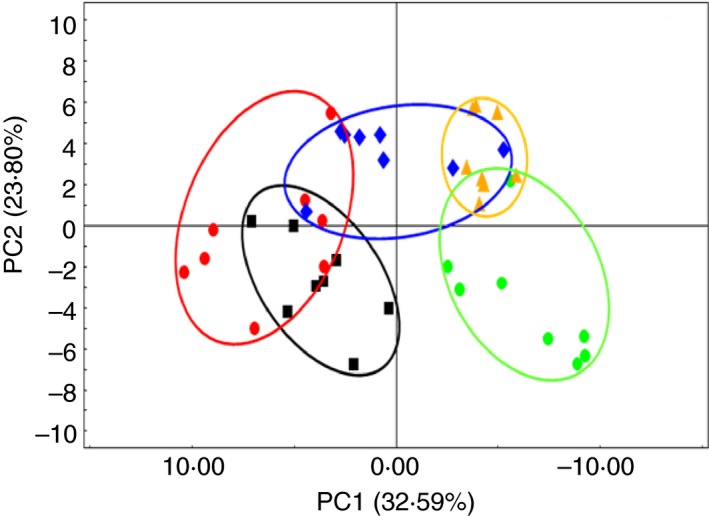
Figure 2.

Scatterplot from PCoA of OTUs shown the differences in microbial community structures of sows among the five physiological stages. The days ( ) 30, (
 ) 60, (
 ) 90, and (
 ) 110 are after artificial fertilization and (
 ) weaning (day 21) is after parturition. [Colour figure can be viewed at http://wileyonlinelibrary.com]
