
Figure 5.
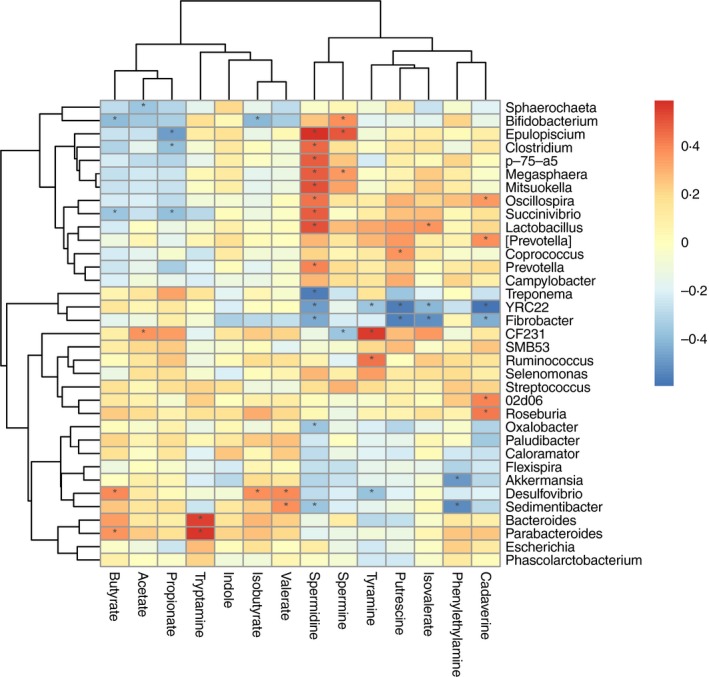
Correlations between the genera and the faecal metabolite concentrations. Only the genera for which abundance was significantly associated with the faecal concentrations of metabolites are presented; the red represents a significantly positive correlation, the blue represents a significantly negative correlation, and the white represents no significant correlation. * means the P value < 0.05. [Colour figure can be viewed at http://wileyonlinelibrary.com]