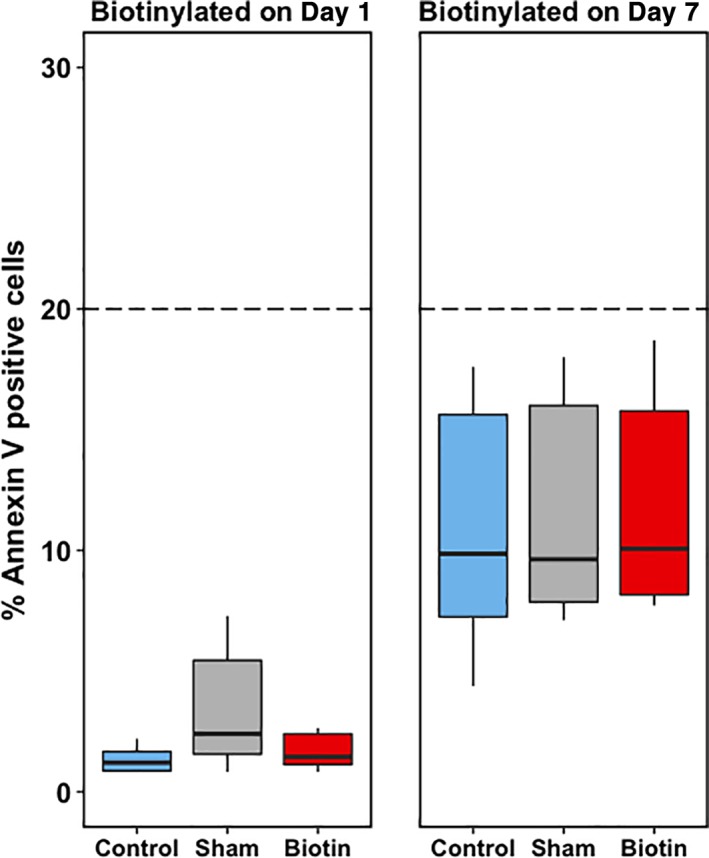
Figure 4.

Annexin V expression of a fresh PC (Day 1, left panel, n = 6) and a stored PC (Day 7, right panel, n = 6). On Day 1, the bioPLT did not show a significant difference in Annexin V–positive cells, compared to control, 1.2% (0.9%‐1.7%; p = 0.56), and sham, 3.4% (1.6%‐5.5%; p = 0.16). On Day 7, the bioPLT also showed no significant difference in annexin V–positive cells: bioPLT, 10.1% (8.2%‐15.8%), compared with control, 9.9% (7.3%‐15.6%; p = 0.09), and sham, 9.6% (7.9%‐16.0%; p = 0.16). [Color figure can be viewed at http://wileyonlinelibrary.com]
