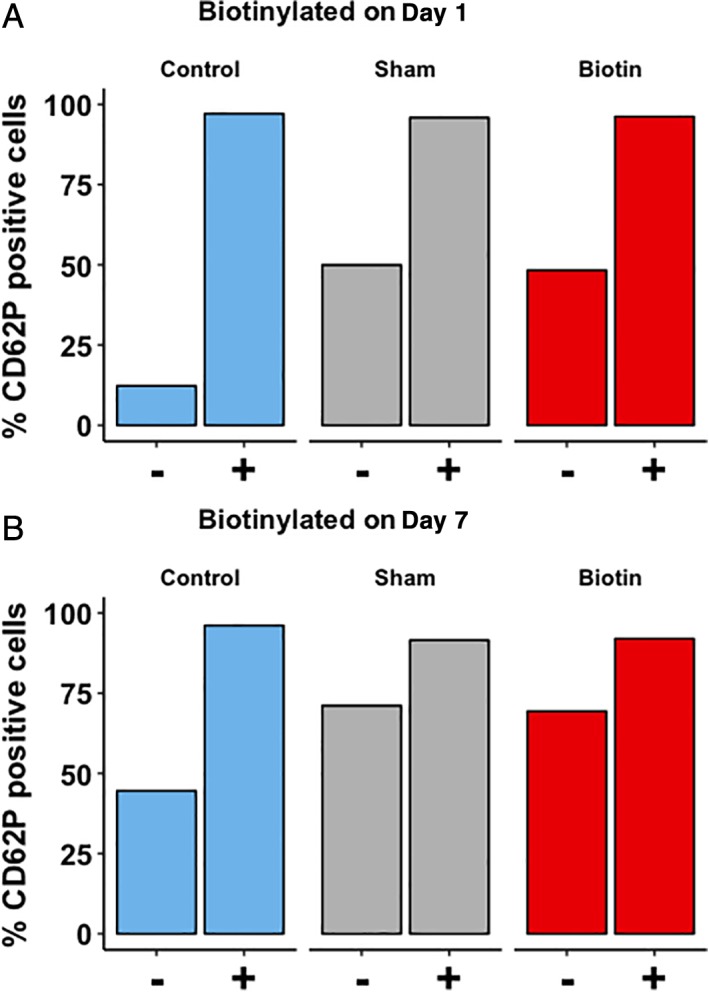
Figure 5.

CD62P expression of a fresh PC (Day 1, A) and a stored PC (Day 7, B). For each condition, left bars (−) represent the unstimulated state, and right bars (+) represent CD62P expression in response to TRAP. After incubation with TRAP, all samples showed an increase in CD62P‐positive cells. On Day 1, the number of CD62P‐positive cells increased in both bioPLT, 48.4% (41.7%‐56.2%), and sham, 50.0% (41.7%‐56.2%), compared to control PLTs, 12.3% (9.5%‐12.7%; p = 0.03). On Day 7, more cells were CD62P positive in the bioPLT, 69.60% (64.5%‐70.3%), and sham, 71.2% (66.4%‐75.7%), compared to the control PLTs, 44.6% (39.7%‐50.3; p = 0.03). No significant difference was observed in comparing CD62P expression after incubation with TRAP in bioPLT with control (Day 1, p = 0.84; Day 7, p = 0.69) or sham PLTs (Day 1, p = 0.11; Day 7, p = 0.13). [Color figure can be viewed at http://wileyonlinelibrary.com]
