
Figure 4.
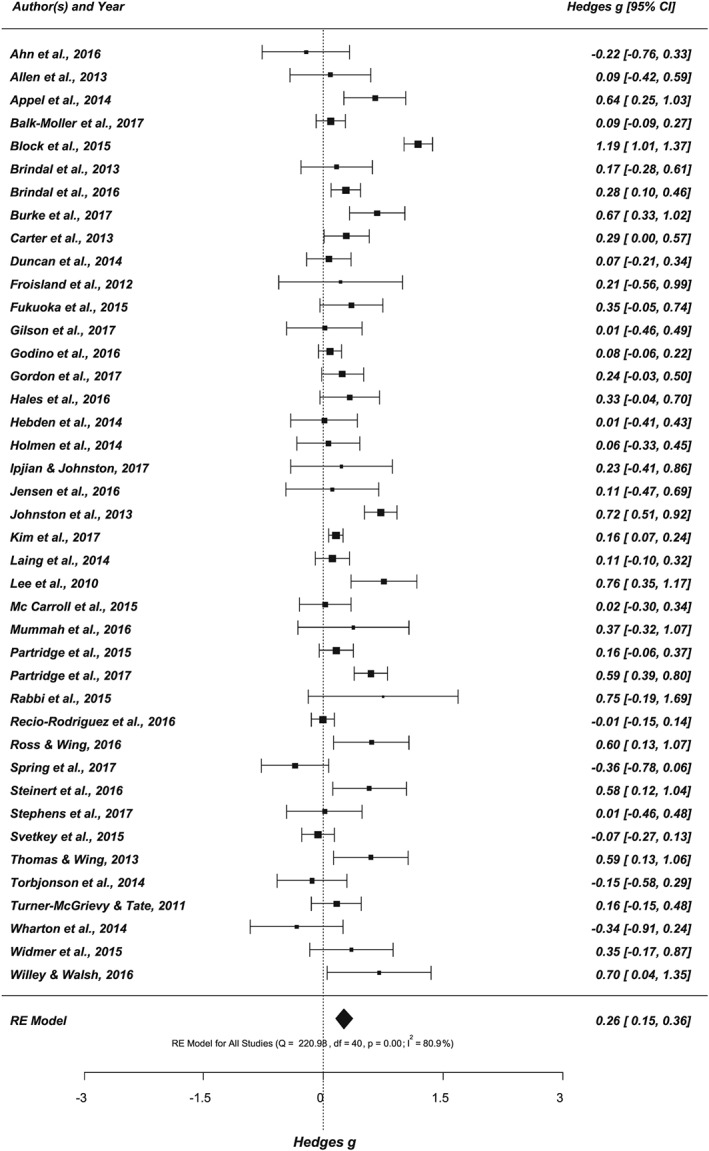
Forest plot showing the effects of app‐based mobile interventions on nutrition behaviours and nutrition‐related health outcomes (k = 41, outcome n = 224; adjusted data set)
Official websites use .gov
A
.gov website belongs to an official
government organization in the United States.
Secure .gov websites use HTTPS
A lock (
) or https:// means you've safely
connected to the .gov website. Share sensitive
information only on official, secure websites.
Forest plot showing the effects of app‐based mobile interventions on nutrition behaviours and nutrition‐related health outcomes (k = 41, outcome n = 224; adjusted data set)