
Figure 3.
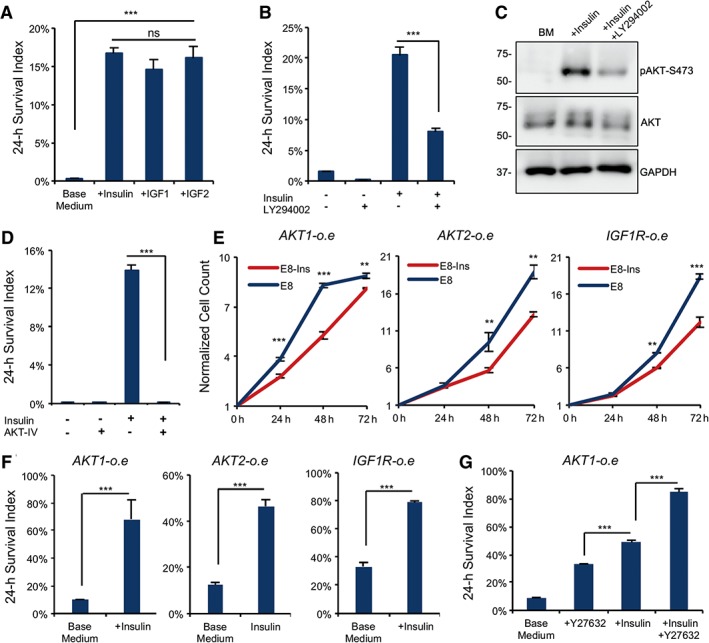
Insulin activates insulin‐like growth factor (IGF) receptor to promote cell survival. (A): Plots comparing cell survival 24 hours after plating on matrigel in the presence or absence of insulin (10 μg/ml), IGF1 (50 ng/ml), and IGF2 (50 ng/ml; ***, p < .001, n = 3). (B): Plots showing 24‐hour survival of dissociated embryonic stem (ES) cells with or without the PI3K inhibitor LY294002 (10 μM) or insulin (***, p < .001, n = 3). (C): Western blot showing levels of AKT and phospho‐AKT‐S473 in the presence or absence of insulin and LY294002 on matrigel‐coated surface 2 hours after plating (n = 3 technical repeats). Quantification is shown in Supporting Information Figure S3B. (D): Plots showing 24‐hour survival of dissociated ES cells with or without AKT inhibitor IV (5 μM; ***, p < .001, n = 3). (E): Cell proliferation of AKT1, AKT2, and IGF1R overexpression cell lines during 72 hours after plating on matrigel‐coated surface in E8 media with and without insulin (***, p < .001; **, p < .01, n = 3; data are normalized to time zero cell count). (F): Plots showing 24‐hour survival of AKT1, AKT2, and IGF1R overexpression cells after plating on matrigel with or without insulin (***, p < .001, n = 3). (G): Plots showing 24‐hour survival of AKT1 overexpression cells after plating on matrigel comparing Y‐27632 and insulin (***, p < .001, n = 3).