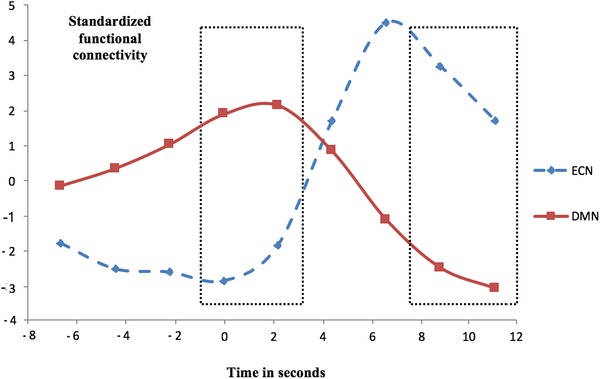
Figure 2.

Slopes of normalized functional connectivity over time for the executive control network (ECN) and the default mode network (DMN). Rectangular frames highlight the epochs of interest. After correction for the HRF delay, the button press occurs at 6 seconds. The y‐axis shows the demeaned beta values resulting from the first stage of the dual regression, representing functional connectivity.
