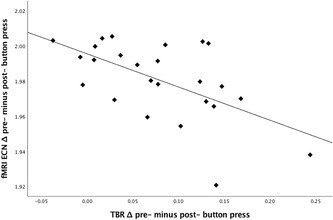
Figure 3.

Scatterplot of the significant relation between the MW‐related changes in frontal EEG theta/beta ratio (TBR; x‐axis) and the corresponding changes in ECN functional connectivity (y‐axis); r(23) = −0.58, P = 0.002. Spearman's ranked order correlation (insensitive to outliers) was also significant; Spearman's r(23) = −0.54, P = 0.006. The plot shows log‐transformed data.
