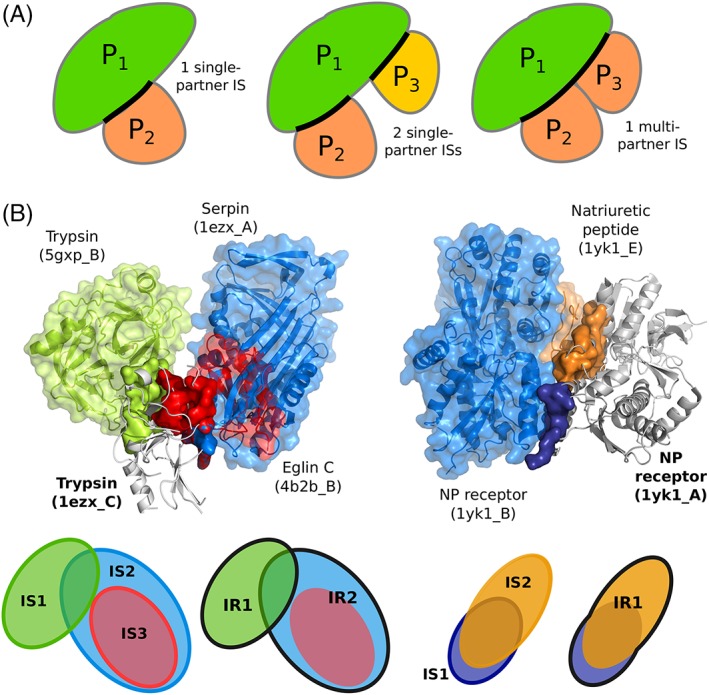
Figure 2.

Examples and schema illustrating the notions of interacting site and interacting region. A, Schematic representation of single‐ and multiple‐partner interacting sites. Three proteins are considered, namely P1, P2, and P3. The ISs defined on P1 are highlighted by thick black lines. See the materials and methods section for a precise definition of the sites issued from multiple partners. B, Two examples of the usage of the protein surface by different partners. The query proteins are displayed as gray cartoons, their interacting sites as opaque colored surfaces, and their partners as colored cartoons and transparent surfaces. Left: trypsin (1ezx_C, in gray) interacts with itself (5gxp_B, in green), serpin (1ezx_A, in blue) and eglin C (4b2b_B, in red). The three corresponding ISs lead to the definition of 2 IRs, as depicted on the schema at the bottom, where each IR is contoured by a thick line. Right: the natriuretic peptide receptor forms a homodimer (1yk1_A, in gray, and 1yk1_B, in blue) to bind its substrate (1yk1_E, in orange). The 2 ISs detected at the surface of one receptor monomer (1yk1_A, in gray) are merged into an IR
