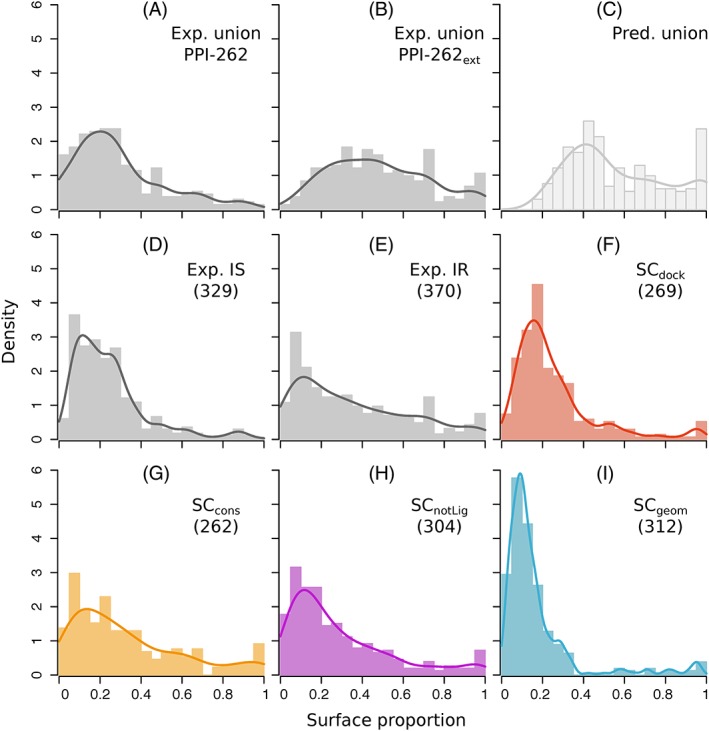
Figure 3.

Proportion of protein surface covered by experimental interfaces and predicted patches. Distribution are reported for: (A) the union of ISs from PPI‐262, (B) the union of IRs from PPI‐262ext (C) the union of patches predicted by dynJET2, (D) individual ISs from PPI‐262, (E) individual IRs from PPI‐262ext,(F‐I) individual patches predicted by each SC. The union of ISs, IRs or predicted patches is realized for each protein. Notice that the sizes of the predicted patches do not add up when considering their union, since several of them overlap [Color figure can be viewed at http://wileyonlinelibrary.com]
