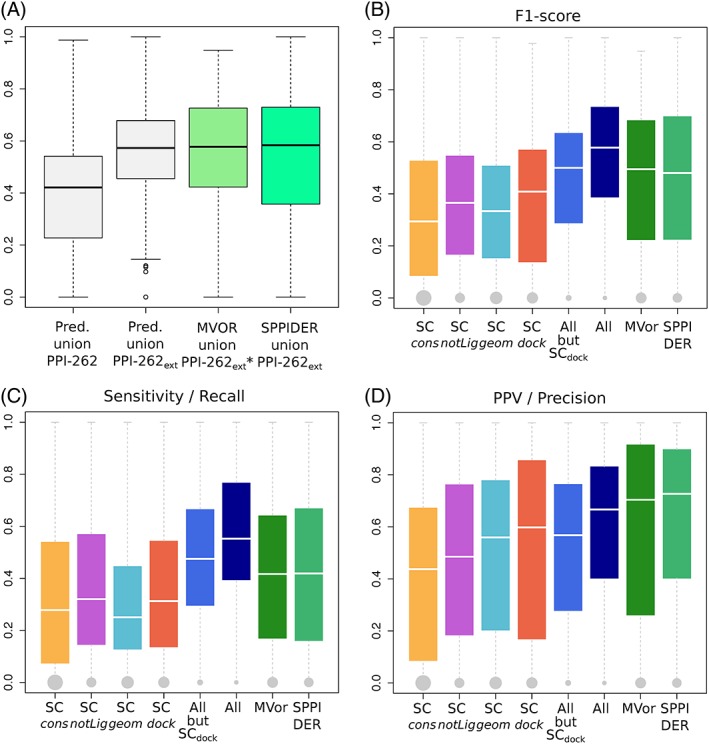
Figure 4.

Agreement between experimental interfaces and predicted patches. A, Distributions of F1‐scores computed for the union of dynJET2 predictions (boxes in light gray), Multi‐VORFFIP predictions (box in light green) and SPPIDER predictions (box in spring green). dynJET2 predictions were assessed against the union of ISs from PPI‐262 and of IRs from PPI‐262ext. Multi‐VORFFIP predictions were assessed against the union of IRs from PPI‐262ext*, a subset from PPI‐262ext involving 252 protein chains. SPPIDER predictions were assessed against the union of IRs from PPI‐262ext. B‐D, Agreement between predicted patches and experimental IRs from PPI‐262ext. For each IR, the best‐matching patch or combination of patches predicted by the strategies/methods indicated in x‐axis is retained. The performance measures are the following: (B) F1‐score, (C) sensitivity (recall), (D) positive predicted value (precision). The sizes of the gray dots are proportional to the number of IRs that could not be detected at all [Color figure can be viewed at http://wileyonlinelibrary.com]
