
Figure 4.
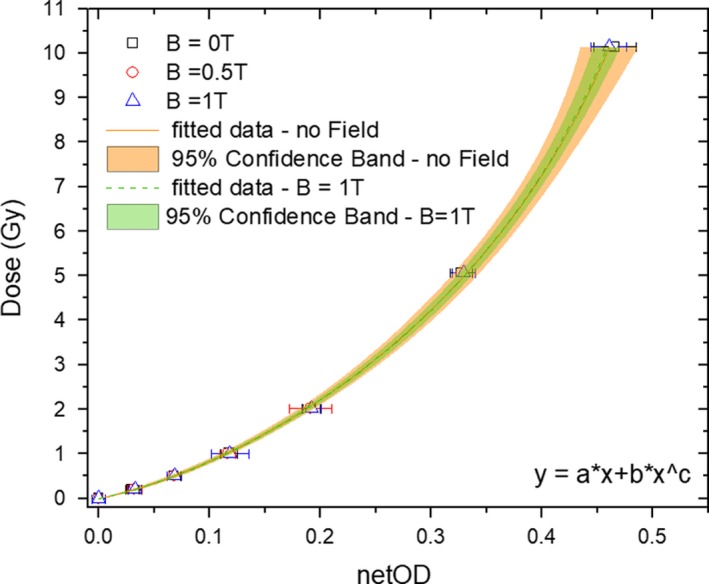
Dose response curves and their corresponding fitting functions obtained for the red channel of the EBT3 films for B = 0T and B = 1 T cases. Confidence bands (95%) are calculated for both fitting functions including the experimental uncertainties. [Color figure can be viewed at http://wileyonlinelibrary.com]