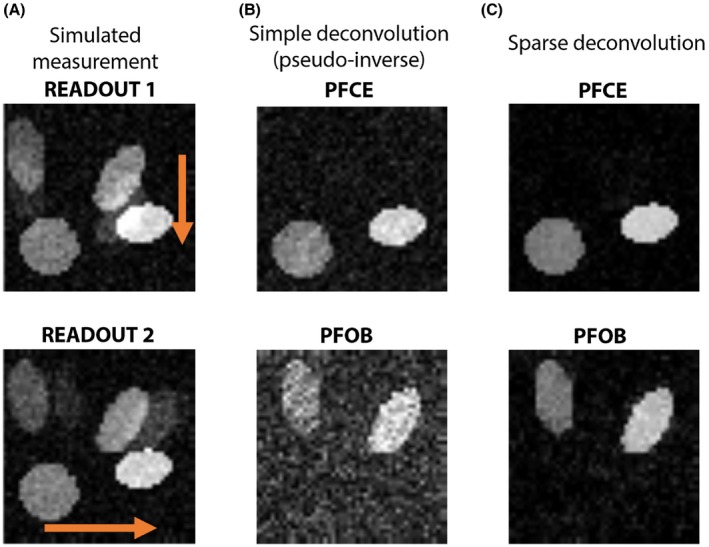
Figure 2.

Simulation of PFOB and PFCE signal separation and chemical shift artifact removal. A, Noisy acquisitions of 2 PFOB and 2 PFCE hot spots with readout in vertical and horizontal directions (orange arrows). The chemical shift artifacts from PFOB are apparent. B, A pseudo‐inverse reconstruction effectively separates the 2 compounds, but results in noise amplification. C, Our sparse deconvolution method achieves excellent signal separation, while preserving SNR. a.u. = arbitrary units
