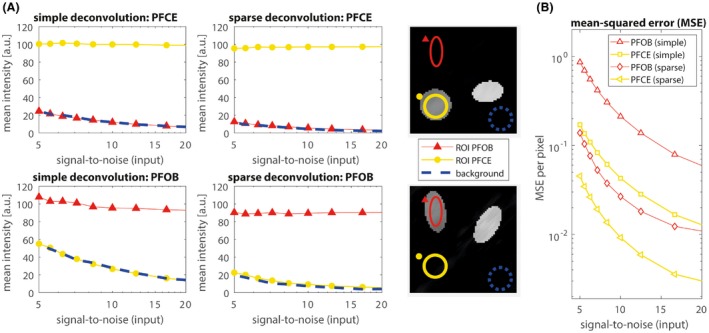
Figure 3.

Simulated results for SNR levels between 5 and 20. A, Red triangles represent the mean signal in an ROI at the location of the PFOB phantom, yellow circles represent the mean signal in an ROI at the location of the PFCE phantom, whereas the blue dashed line indicates the mean signal intensity in noise ROI in the background. Both PFOB and PFCE mean signal intensities are relatively constant over the range of SNR values, and both methods achieve good signal separation. There is no residual PFOB signal in the PFCE images (top two graphs), given that the residual signal in the PFOB ROI (red triangles) is equal to the mean noise signal (blue dashed line). The same holds for residual PFCE in the PFOB image (bottom 2 graphs). However, noise levels with the new sparse‐deconvolution method are much lower compared to simple pseudo‐inverse reconstruction. B, Average mean squared error per pixel for the separated PFOB and PFCE images. Error levels are much lower for sparse deconvolution than for simple deconvolution. a.u. = arbitrary units; MSE = mean squared error
