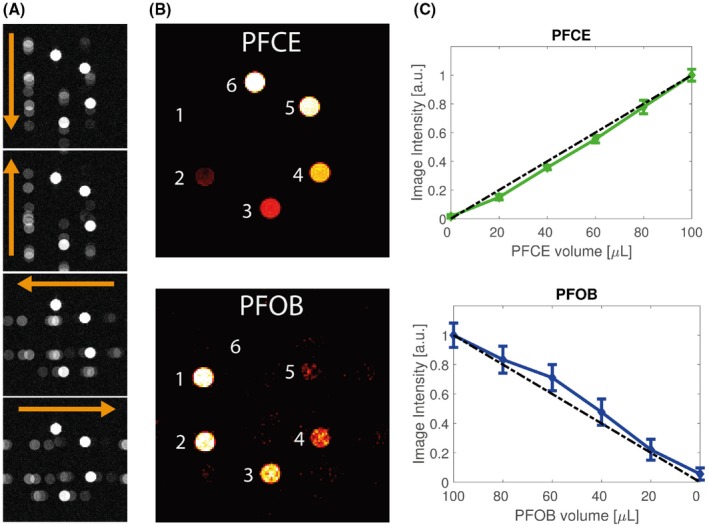
Figure 4.

Phantom measurement of 6 Eppendorf tubes containing PFOB/PFCE with varying volume ratios. A, 19F‐MRI of the 6 phantoms with readout in 4 different directions (orange arrows). B, Reconstructions of PFOB and PFCE signals. C, Normalized mean signal intensities and standard deviation in the phantoms as function of PFCE and PFOB volume contributions. The dashed black line indicates a linear increase from 0 to 1. The coefficients of variation for PFOB and PFCE were r2 = 0.966 and r2 = 0.990, respectively. a.u. = arbitrary units
