
Figure 2.
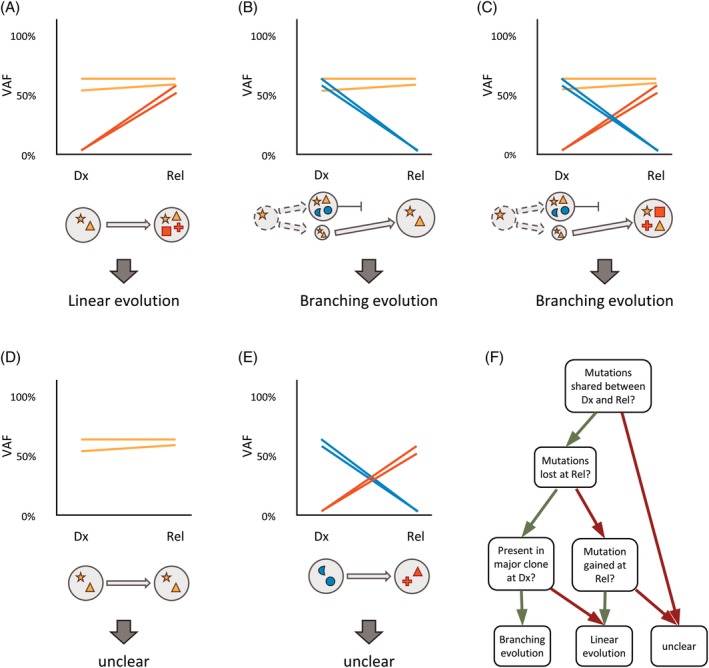
Examples of clonal evolution between diagnosis and relapse in a single patient. Each line corresponds to an individual mutation and illustrates the presence of the mutation at both time points, colored by its stability. Each circle corresponds to an individual cell clone, defined by harboring the identical set of mutations. Somatic mutations are represented by different symbols, colored based on their stability. Cells without symbol refer to wild type cells without somatic mutations. VAF, variant allele frequency; Dx, diagnosis; Rel, relapse; orange, stable at Dx and Rel; blue, lost at Rel; red, gained at Rel. (A) Genetic evolution with stable mutations and gained mutations. (B) Genetic evolution with stable mutations and lost mutations. (C) Genetic evolution with stable mutations, gained mutations, and lost mutations. (D) Genetic evolution with stable mutations only. (E) Genetic evolution with gained mutations and lost mutations only. (F) Decision tree to define the underlying model of genetic evolution