Figure 5.

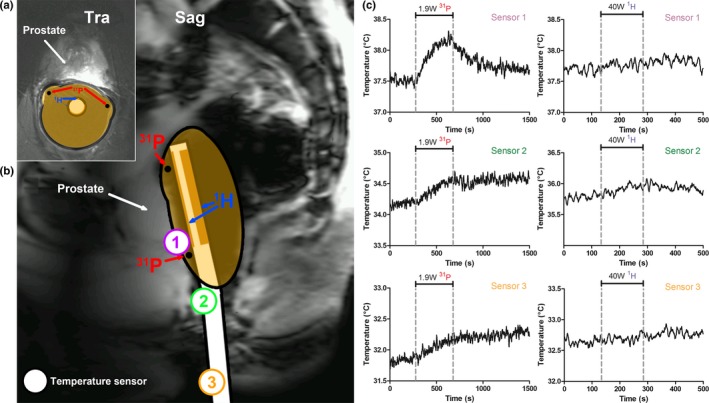
In vivo transversal (a) and sagittal (b) image of the prostate of a volunteer, illustrating the standard endorectal coil position during prostate MR examinations. The position of the temperature sensors that were placed during the in vivo temperature measurements are depicted on the sagittal image (b). The temperature during the 31P (at 1.9 W, left graph) and 1H (at 40 W, right graph) transmit period is depicted for sensor 1, 2, and 3 (c). The dashed lines indicate the period in which power was transmitted (6 min for 31P and 2.5 min for 1H). MR, magnetic resonance. [Color figure can be viewed at http://www.wileyonlinelibrary.com]
