Figure 6.

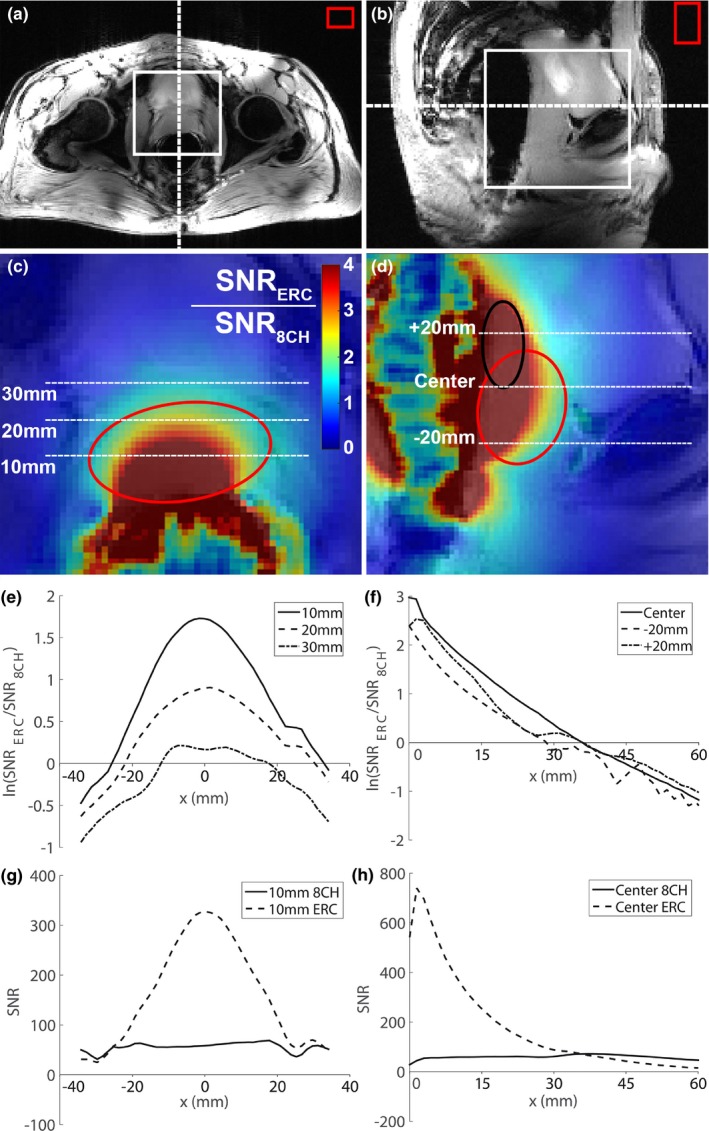
Gradient echo imaging of the prostate of a healthy volunteer in transversal (a) and sagittal (b) orientation using the 8‐channel external body array (8CH). The red circles (online version only) indicate the outline of the prostate and the black circle (online version only) indicates the outline of the seminal vesicles. The dashed lines indicate the location of the transversal and sagittal slice with respect to each other (a, b), the white box indicates the position of the respective colormap image (c, d) and the red box indicates the ROI in air that was used to estimate the noise. A map of the ratio of the SNR (SNRERC/SNR8CH) obtained with only the ERC’s 1H asymmetric microstrip and only the 8CH array was determined and overlaid on the GRE transversal (c) and sagittal (d) imaging. The cross section of the SNR ratio was obtained at three different locations in the left right direction on the transversal imaging at 10, 20, and 30 mm anterior to the endorectal coil (e). The cross section of the SNR ratio was also determined at three different locations on the sagittal images, through the center of the ERC and 20 mm superior and inferior to center of the ERC (f). The natural logarithm of the SNR ratio (ln(SNRERC/SNR8CH)) was plotted with respect to the location. The first pixel anterior to the ERC with actual signal was taken as x = 0 for the sagittal cross section and the center of the prostate was used as x = 0 in the transversal cross section. The absolute SNR of the ERC and the 8CH are also shown for the cross section at 10 mm anterior to the ERC on the transversal image (g) and for the central cross section on the sagittal image (h). ERC, endorectal radiofrequency coil; ROI, region of interest; SNR, signal‐to‐noise. [Color figure can be viewed at http://www.wileyonlinelibrary.com]
