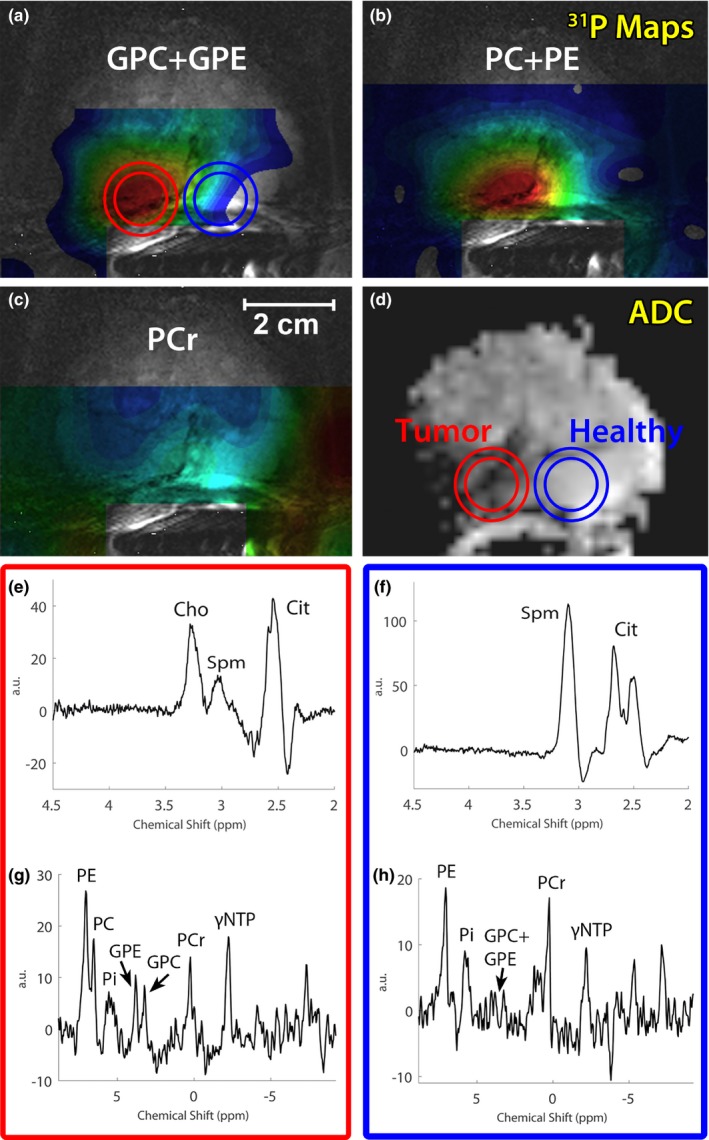
Figure 8.

GPC + GPE, PC + PE, and PCr metabolite maps of a patient with metastatic Gleason 4 + 4 prostate cancer (67 yr old, 88 kg, MR‐TRUS guided biopsy) (a,b, and c) overlaid over a T2‐weighted image. The corresponding ADC map (d) is also shown, indicating a large prostate cancer lesion on the right side of the prostate. 1H (e,f) and 31P (g,h) spectra are shown of the cancer lesion (red circle) as well as a location within healthy tissue (blue circle) (online version only). 31P MRSI measurement set a) was used. GPC, glycerophosphocholine; GPE, glycerophosphoethanolamine; MRSI, magnetic resonance spectroscopic imaging; PC, phosphocholine; PE, phosphoethanolamine.
