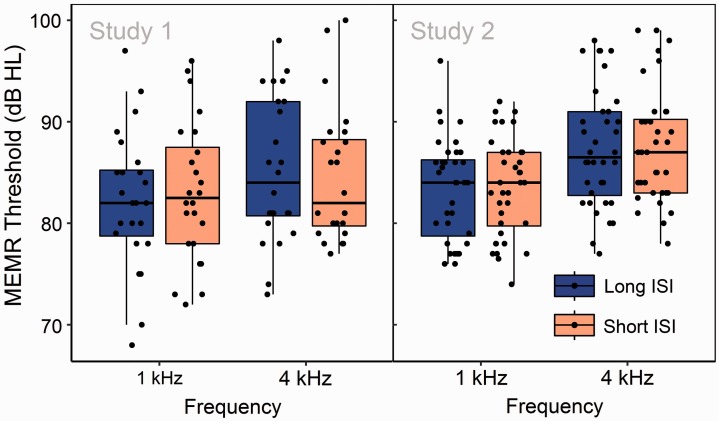
Figure 1.
Distributions of ARTs at 1 and 4 kHz, obtained using short (2.5 s) and long (8.5 s) ISIs. Points correspond to individual participants, upper and lower hinges to the first and third quartiles, upper whiskers to the highest value within 1.5 × IQR of the upper hinge (where IQR is the interquartile range), and lower whiskers to the lowest value within 1.5 × IQR of the lower hinge. No significant ISI-related differences in threshold are evident. Note. ISI = interstimulus interval; MEMR = middle-ear muscle reflex.

