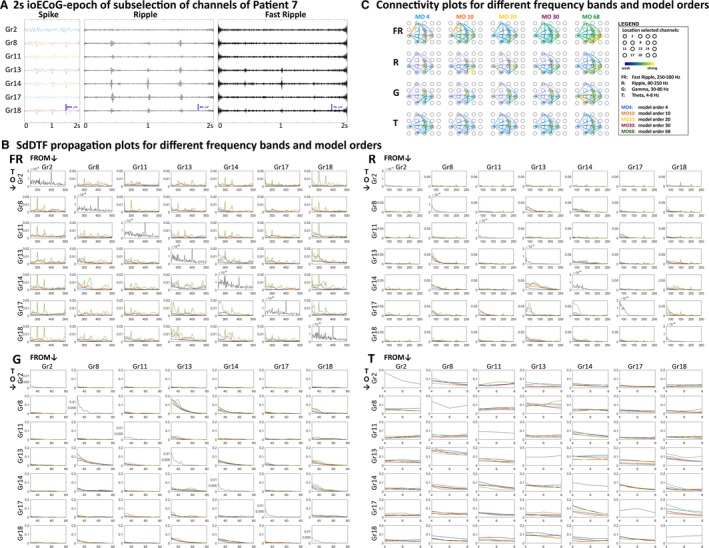
Figure 3.

Short‐time direct directed transfer function (SdDTF) propagation and connectivity plots for different frequency bands and model orders (MOs) in selected channels of epoch 1 of example Patient 7. A, Two‐second epoch of intraoperative electrocorticography (ioECoG) in a subselection of channels of example Patient 7 in spike (infinite impulse response filter: 0‐100 Hz), ripple (finite impulse response [FIR] filter: 80‐250 Hz), and fast ripple (FR; FIR filter: 250‐500 Hz) settings. The ioECoG shows FRs in Gr13 and Gr14, ripples in Gr8, Gr13, Gr14, Gr17, and Gr18, and spikes in the same channels as ripples. B, SdDTF propagation plots for the FR, ripple (R), gamma (G), and theta (T) frequency bands. Each off‐diagonal plot shows the SdDTF propagation from the channel indicated above the column to the channel marked before the row for different MOs (blue = MO 4, orange = MO 10, yellow = MO 20, purple = MO 30, green = MO 68). The columns thus represent the outgoing SdDTF connectivity strength of the channels, and the rows represent the incoming connectivity strength. The diagonal plots show the power spectra of the channels. In the FR band, starting from MO 4, we see a “bump” in the SdDTF propagation plots of the channels showing FRs (Gr13, Gr14, and to a lesser extent Gr18). At MO 68, the model overfits harmonics of the powerline artifact, and the difference between channels with and without events becomes less clear. In the ripple band, there is a clear SdDTF flow between Gr8, Gr13, and Gr14, starting at MO 4. From MO 10 onward, there is also SdDTF propagation to Gr17 and Gr18, which also shows ripple events. The model starts to overfit the harmonics of the powerline artifact at MO 68. In the gamma band, there is a clear SdDTF flow between Gr8, Gr13, Gr14, and Gr18, the channels showing events, for all MOs. In the theta band, the SdDTF shows less clear results, but does identify a strong connection between Gr8 and Gr13. In the theta and gamma bands, different MOs yield similar propagation plots, with slightly more detail with increasing MO. C, Integrated SdDTF propagation for different frequency bands (rows) and MOs (columns) projected on a grid. Within each subplot, connections are normalized to the strongest connection. In the FR band, the connections between Gr13, Gr14, and Gr18, the channels with events, are between the strongest connections for all MOs. At MOs 4 and 10, there also exists a strong connection between Gr2 and Gr11, two channels not showing FRs. From MO 20 onward, the connection between Gr13 and Gr14 is clearly stronger than the connection between Gr 2 and Gr11. At MO 68, the overall connectivity strength is higher over the whole grid, and there appear strong connections between channels showing clear FRs and their neighboring electrodes. In the ripple band, similar to the SdDTF propagation plots, the connections to Gr17 and Gr18 start to get stronger from MO 10 onward. At MO 68, the overall connectivity is higher, and the connection between Gr17 and Gr11 starts to disappear again. In the gamma band, MOs 4 to 30 provide similar connectivity plots, with the strongest connections between the channels showing events. At MO 68, the overall connectivity strength is higher. In the theta band, all MOs provide a similar connectivity plot, with the strongest connection between Gr8 and Gr13
