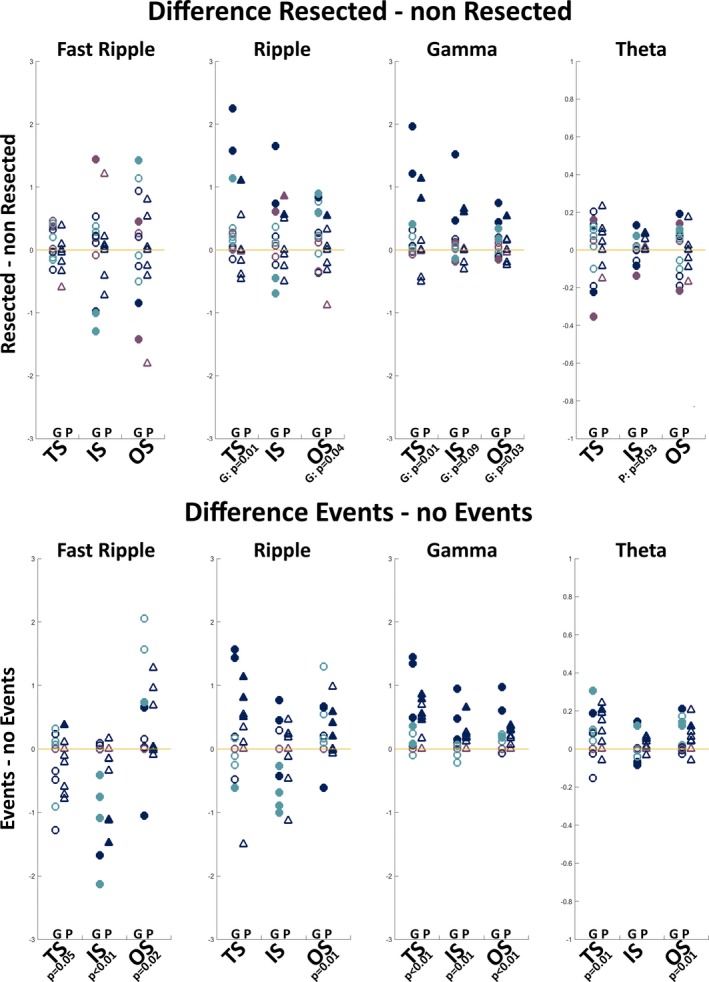
Figure 4.

Difference in directed strength measures in the fast ripple, ripple, gamma, and theta bands between the resected and nonresected areas (upper) and between channels with and without events (lower). The difference between resected and nonresected areas or channels with and without events is calculated by subtracting the median value of the electrodes in the former group from the median value of the electrodes in the latter group in each patient. Positive values indicate a higher value and negative values indicate a lower value in resected/event channels than nonresected/nonevent channels. Colors indicate whether a patient had events in the epochs used for network analysis (dark blue), events in the overall intraoperative electrocorticography (ioECoG) recording but not in the analyzed epochs (light blue), or no events in the ioECoG at all (purple). Circles are patients with good (G) surgery outcome; triangles are patients with poor (P) surgery outcome. A filled symbol indicates a significant difference between the resected and nonresected areas or channels with and without events at the individual patient level. The given P values indicate significant difference at the group level. What can be seen is that channels covering the resected area in patients with good outcome show a higher total strength (TS) and outstrength (OS) in the ripple and gamma bands than channels covering the nonresected area. In the gamma band, there is also a trend toward a higher instrength (IS). Channels covering the resected area in patients with poor outcome show a higher IS in the theta band than channels not covering the resected area. Channels with events show a lower TS and IS, and higher OS in the fast ripple band, a higher OS in the ripple band, a higher TS, IS, and OS in the gamma band, and a higher TS and OS in the theta band than channels without events
