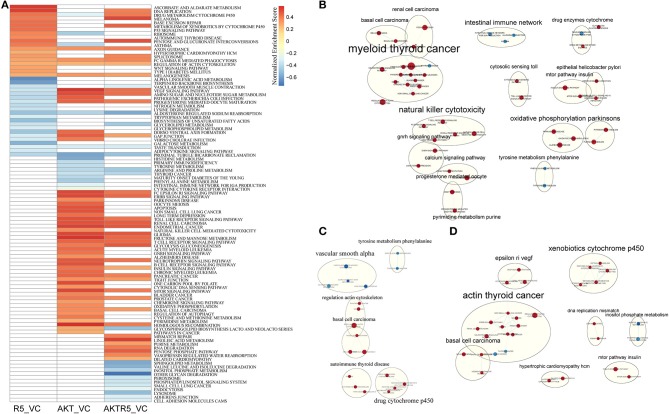
Figure 1.
The results of GSEA analysis. (A) The heatmap of GSEA enriched pathways among different treatment groups. (B) The pathway network of siAKT group. (C) The pathway network of R5020 group. (D) The pathway network of siAKT+R5020 group. The blue dots represent upregulated pathways and the red dots were downregulated pathways.

