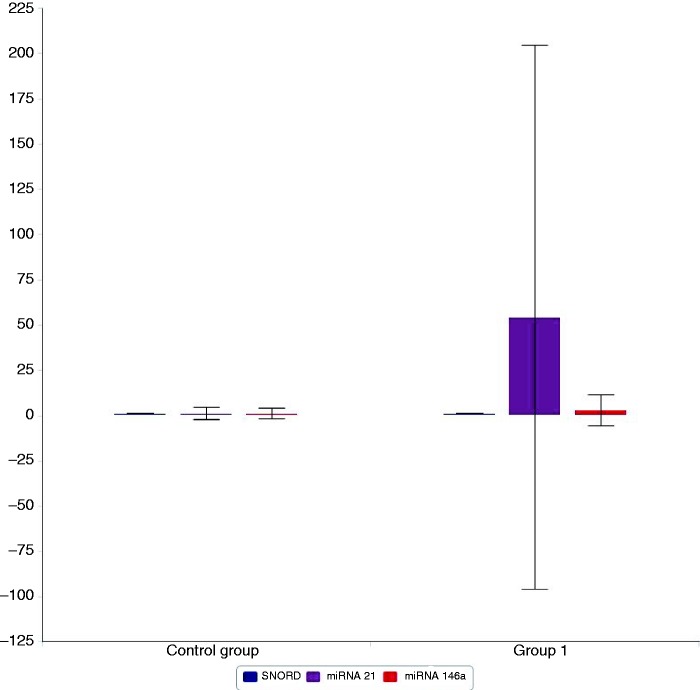
Figure 1.
Plasma expression of SNORD 68 (in blue), miR-21 (in violet) and miR-146a (in red) in group 1 (asthmatic children) and the control group (group 2). miR-21 and miR-146a were significantly up-regulated in group 1 (42.6- and 4.74-fold higher than the average expression, respectively). P = 0.02 and P = 0.04, respectively.

