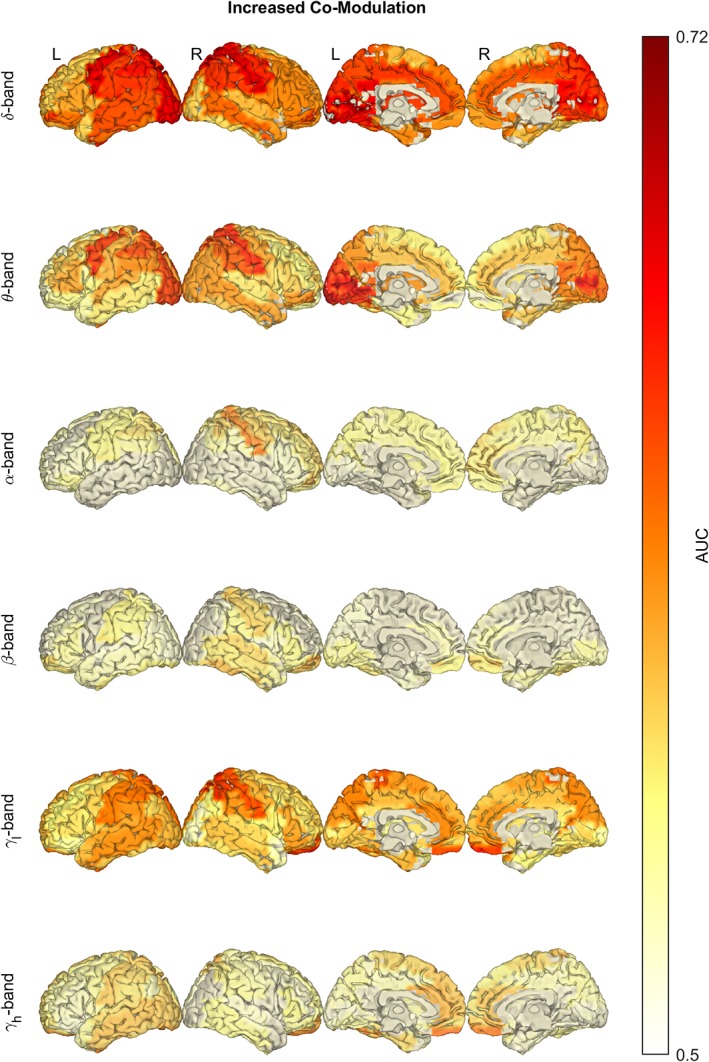
Figure 2.

In amyotrophic lateral sclerosis (ALS), the average co‐modulation is significantly increased in the δ, θ and γ frequency bands. Notice the increase of amplitude envelope correlation (AEC) in the central and posterior regions (δ‐, θ‐ and γl‐band) and frontal regions (δ‐ and γl‐band). Statistical difference between healthy controls (n = 47) and ALS patients (n = 74) was assessed in the six defined frequency bands using empirical Bayesian inference (EBI). False discovery rate (FDR) was set to 10%, yielding an estimated statistical power of 1–β = .93 and posterior probability of P 1 = .71 (across all frequency bands). AUC, area under the receiver operating characteristic curve. Frequency bands: δ (2–4 Hz), θ (5–7 Hz), α (8–13 Hz), β (14–30 Hz) and γ (γl: 31–47 Hz, γh: 53–97 Hz) [Color figure can be viewed at http://wileyonlinelibrary.com]
