
Figure 3.
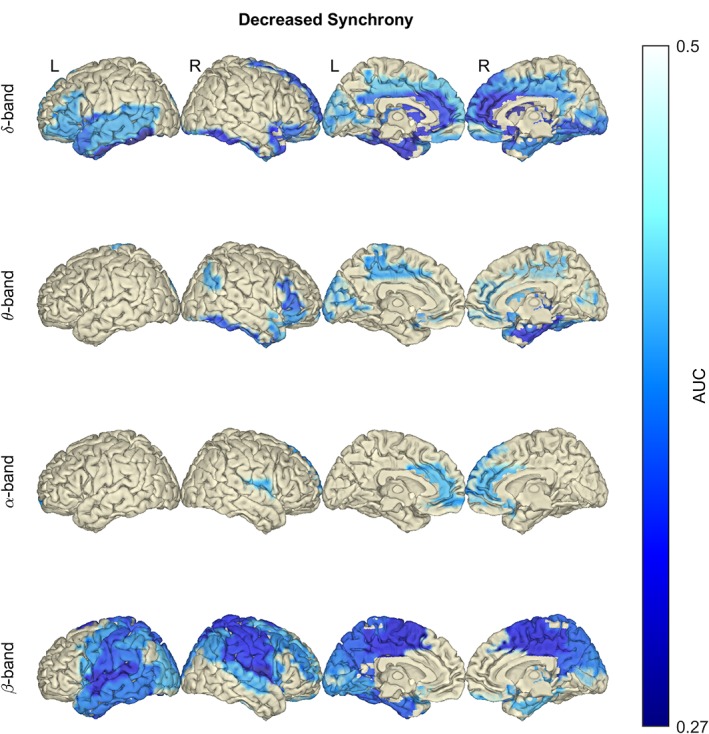
In amyotrophic lateral sclerosis (ALS), the average synchrony is significantly decreased in the δ and β frequency bands. Notice the decrease of imaginary coherence (iCoh) in temporal and frontal lobes (δ‐, θ‐ and α‐band), and in the sensorimotor cortex (β‐band). Statistical difference between healthy controls (n = 47) and ALS patients (n = 74) was assessed in the six defined frequency bands using empirical Bayesian inference (EBI). False discovery rate (FDR) was set to 10%, yielding an estimated statistical power of 1–β = .55 and posterior probability of P 1 = .77 (across all frequency bands). AUC, area under the receiver operating characteristic curve. No changes were detected in the γ frequency bands; therefore, they are not shown. Frequency bands: δ (2–4 Hz), θ (5–7 Hz), α (8–13 Hz) and β (14–30 Hz) [Color figure can be viewed at http://wileyonlinelibrary.com]