Figure 1.

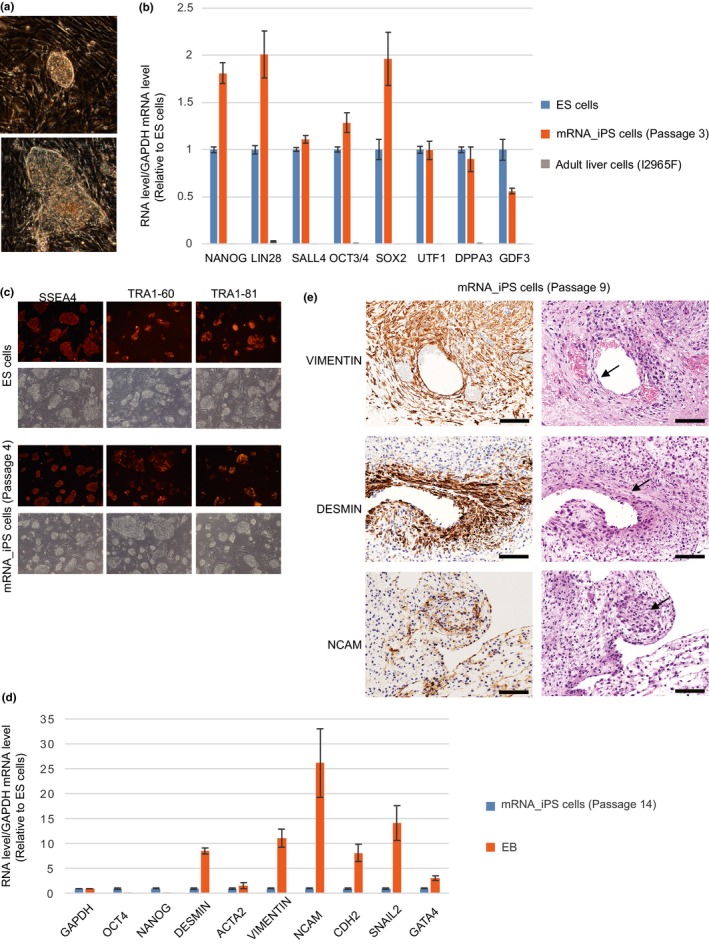
Generation of marmoset iPS cells by transfection of mRNAs and miRNAs. (a) iPS cell colonies appeared after RNA‐based reprogramming. (b) qPCR analysis of ES cell marker genes in mRNA_iPS cells. Adult liver cells (I2965F), from which mRNA_iPS cells were derived, do not express ES cell marker genes. The number of passages of iPS cells examined is shown in parentheses. Error bars represent SE (N = 3). (c) Immunofluorescence analysis of ES cell surface antigens. ES cell surface antigen‐negative cells are MEF used for feeder cells. (d) qPCR analysis of ES cell marker and differentiation marker genes in EBs. Error bars represent SE (N = 3). (e) Formation of blood vessel‐like structure, muscle‐like structure and neuronal marker‐positive cells in teratoma. They are indicated by arrows. The results of immunostaining using the antibodies indicated and H&E staining are shown. Error bar = 100 μm
