
Figure 1.
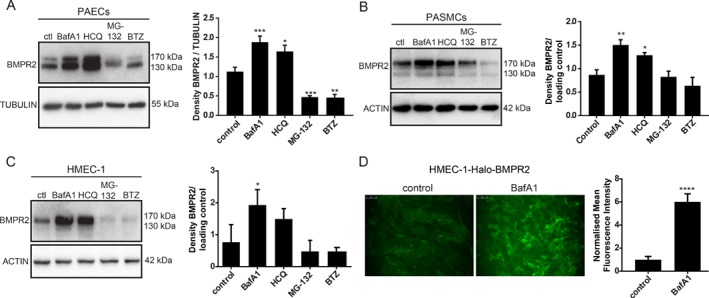
BMPR2 is degraded through the lysosomal pathway in human PAECs, PASMCs, and HMEC‐1. (A–C) BMPR2 protein levels increased after treatment with lysosomal inhibitors. Left panel: western blot analysis of BMPR2 protein levels after (A) PAECs, (B) PASMCs, and (C) HMEC‐1 were treated for 6 h with BafA1(20 nm), HCQ (20 μm), MG‐132 (5 μm), and BTZ (10 nm). Tubulin or actin was used as a loading control. Representative results of at least three independent experiments are shown. Right panels: quantification of BMPR2 levels normalised to the loading control is presented as mean ± SEM. *p < 0.05; **p < 0.005; ***p < 0.001. (D) Cell surface expression of BMPR2 after inhibition of lysosomal degradation. HMEC‐1‐Halo‐BMPR2 were treated with BafA1 (20 nm) for 16 h and stained with the non‐permeable Halo Alexa Fluor 488 ligand. Left panel: Fluorescence microscopy images of BMPR2 localisation are shown. Images are representative of at least three independent experiments. Right panel: quantification of HMEC‐1‐Halo‐BMPR2 mean fluorescence intensity is shown. Data are presented as mean ± SEM. ****p < 0.0001.