
Figure 3.
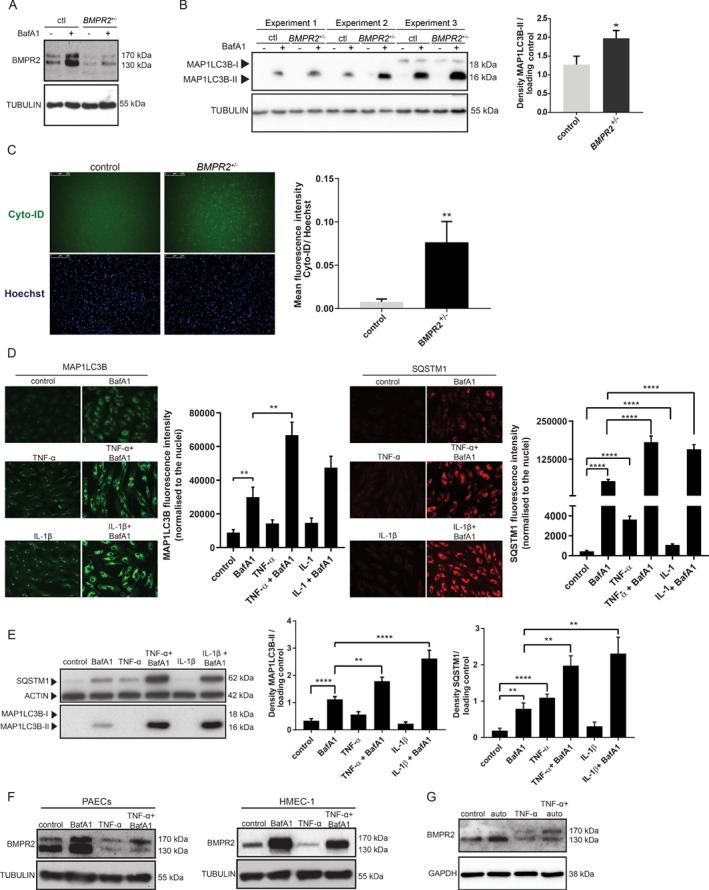
W9X mutation in BMPR2 and inflammation are sufficient to induce autophagy in endothelial cells. (A) Western blot showing BMPR2 protein expression after BMPR2 +/− iPSC‐ECs and isogenic control iPSC‐ECs were treated for 6 h with BafA1(20 nm). Tubulin was used as a loading control. Representative results of three independent experiments are shown. (B) Left panel: western blot of three independent experiments showing MAP1LC3B protein expression after BMPR2 +/− iPSC‐ECs and control iPSC‐ECs were treated for 6 h with BafA1 (20 nm). Tubulin was used as a loading control. Quantification of MAP1LC3B levels normalised to the loading control is presented as mean ± SEM. *p < 0.05. Right panel: western blot showing SQSTM1 protein expression after BMPR2 +/− iPSC‐ECs and control iPSC‐ECs were treated for 6 h with BafA1 (20 nm). Actin was used as a loading control. Representative results of three independent experiments are shown. Quantification of SQSTM1 levels normalised to the loading control is presented as mean ± SEM. (C) Autophagic vesicles were quantified using Cyto‐ID. Left panel: representative fluorescence microscopy images. Right panel: quantification of the Cyto‐ID mean fluorescence intensity. The data are presented as fold increases relative to Hoechst. Data of three independent experiments are shown as mean ± SEM. **p < 0.005. (D, E) PAECs were treated with TNF‐α (30 ng/ml) and IL‐1β (10 ng/ml) for 16 h or 24 h with and without BafA1 (20 nm). (D) Cells were fixed and stained for MAP1LC3B and SQSTM1. MAP1LC3B and SQSTM1 were analysed by fluorescence microscopy (array scan). Left panel: representative images showing MAP1LC3B staining in green. Array scan quantification based on ‘spot total intensity per object’. Quantification of data from three independent experiments performed in duplicates is shown as mean ± SEM. **p < 0.005. Right panel: representative images showing SQSTM1 staining in red. Array scan quantification based on ‘spot total intensity per object’. Quantification of data from three independent experiments performed in duplicates is shown as mean ± SEM. ****p < 0.0001. (E) Left panel: cells were lysed and MAP1LC3B and SQSTM1 levels were analysed by western blotting. Actin was used as a loading control. Representative results of three independent experiments are shown. Right panel: quantification of MAP1LC3B and SQSTM1 levels normalised to the loading control is presented as mean ± SEM. **p < 0.005; ****p < 0.0001. (F, G) BMPR2 levels were analysed by western blotting after cells were stimulated with TNF‐α (30 ng/ml) and BafA1 (20 nm) or auto (0.1 μm), respectively.