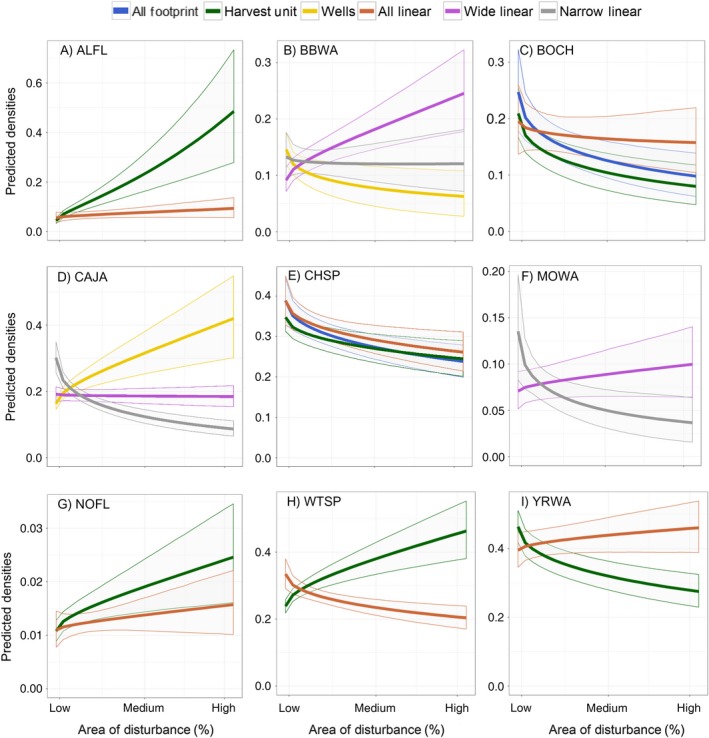
Figure 3.

Predicted densities (±90% confidence envelopes) for each stressor based on the best disturbance model(s) for species that had additive cumulative effects models: (A) Alder Flycatcher (ALFL), (B) Bay‐breasted Warbler (BBWA), (C) Boreal Chickadee (BOCH), (D) Canada Jay (CAJA), (E) Chipping Sparrow (CHSP), (F) Mourning Warbler (MOWA), (G) Northern Flicker (NOFL), (H) White‐throated Sparrow (WTSP), and (G) Yellow‐rumped warbler (YRWA). Results for the two best models are presented simultaneously in the same graph for Boreal Chickadee and Chipping Sparrow. The x‐axis is the range of stressor percent cover values observed in this study. The predicted densities for each stressor are calculated while holding all other model predictors constant at their mean values.
