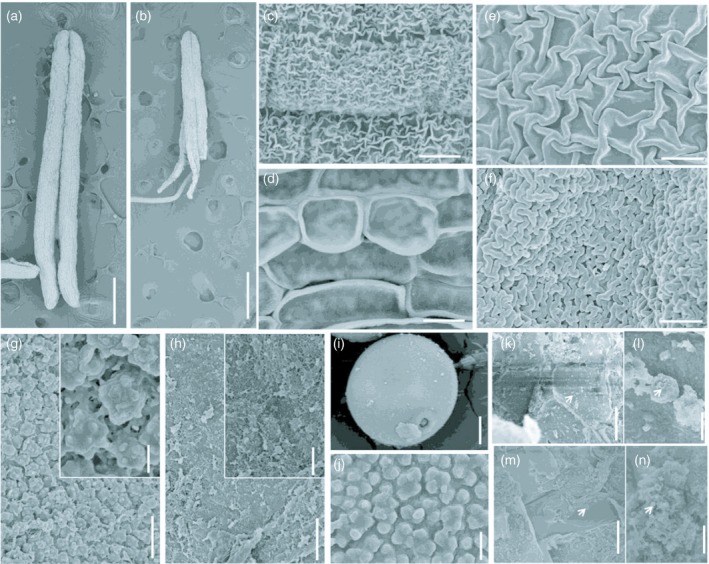
Figure 4.

Scanning electron microscopy analysis of anthers and pollen grains in wild‐type and the tip3 mutant. (a, b) Anthers from the wild‐type (a) and tip3 (b) at stage 13. (c–f) Anther epidermis observation of the wild‐type (c, e) and tip3 (d, f) at stage 13. (g, h) Inner surface of epidermis in the wild‐type (g) and tip3 (h) at stage 13. (i, j) Wild‐type pollen grain (i) and the enlarged surface on the pollen exine (j) at stage 13. (k–n) Observation of pollen grains degradation of in tip3 at stages 10 (k, l) and 13 (m, n). An enlarged observation of degraded pollen grains (l, n). The white arrow refers to degraded particles. Bars represent 500 μm in (a, b); 10 μm in (c, d, i); 2.5 μm in (e−h, k, m); 0.5 μm in (j, l, n).
