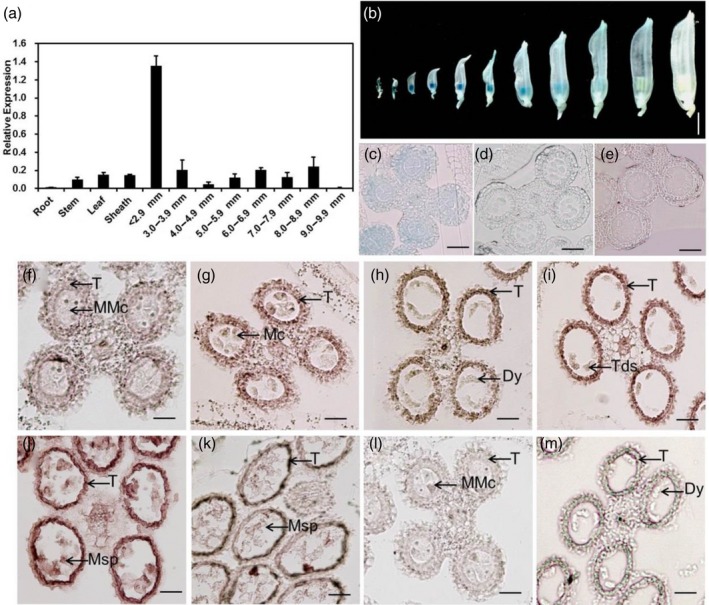
Figure 8.

Expression pattern of the TIP3 gene. (a) qRT‐PCR analysis of TIP3. OsACTIN was used as the reference. Data are presented as mean ± SE. According to the length of spikelet, anthers were divided into different groups. (b) GUS staining of transgenic anthers containing pTIP3::GUS. Bar represents 3 mM. (c, d) Transverse section analysis of GUS‐stained anthers at stages 6, 9 and 11, respectively. Bar represents 50 μm. (f–m) In situ hybridization analysis of TIP3 in wild‐type anthers. Hybridized with TIP3 antisense probe at stage 6–11; (f–k), sense probe at stage 6 (l) and stage 8a (m). MMC, microspore mother cell; MC, meiotic cell; T, tapetum; Dy, dyad cell; Tds, tetrads; Msp, microspore. Bar represents 40 μm.
