
Figure 4.
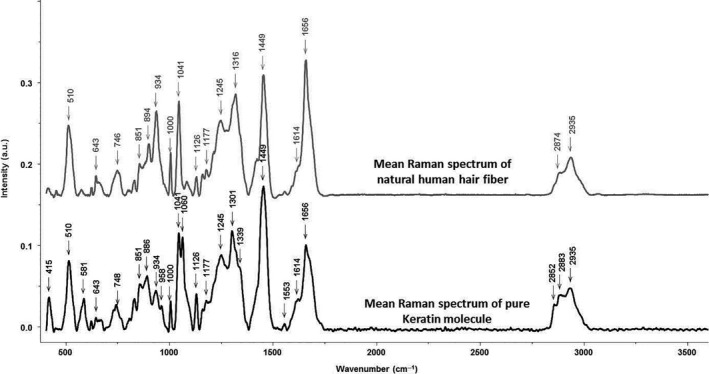
Comparison between mean Raman spectra of natural human hair fibres (grey) and pure keratin molecule (black) on the 400–3600 cm−1 spectral range
Official websites use .gov
A
.gov website belongs to an official
government organization in the United States.
Secure .gov websites use HTTPS
A lock (
) or https:// means you've safely
connected to the .gov website. Share sensitive
information only on official, secure websites.
Comparison between mean Raman spectra of natural human hair fibres (grey) and pure keratin molecule (black) on the 400–3600 cm−1 spectral range