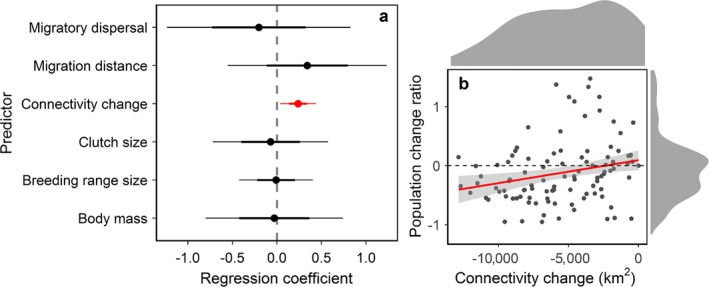
Figure 4.

Changes in functional connectivity of migration networks is the only significant predictor for population declines of migratory birds. (a) Estimated coefficients ±95% (thin lines) and 68% confidence interval (thick lines) of predictors for population change ratio using a full model of multivariable phylogenetic linear mixed model. The significant predictor is in red. (b) The effect of changes in functional connectivity on population change ratios of the eight study species. We measured population change ratios using 2001 as the baseline year, the first year of the bird survey. The relationship between population change ratio and changes in functional connectivity were represented by a fitted line (red line) with 95% confidence intervals (gray area). When functional connectivity declines, populations decline. Density plots on top and right show distributions of connectivity change and population change ratio, respectively.
