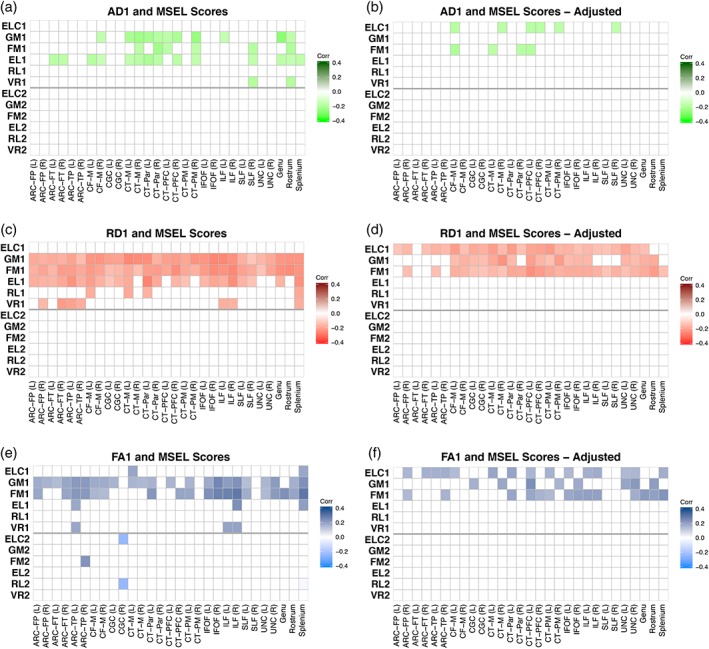
Figure 5.

Correlations between DTI parameters at age 1 and cognitive scores at ages 1 and 2. Unadjusted correlations are shown between AD (a), RD (c), and FA (e) at age 1 and general cognitive ability (ELC), gross motor (GM), fine motor (FM), expressive language (EL), receptive language (RL), and visual reception (VR) scores at ages 1 and 2. Adjusted correlations (corrected for gestational age at birth, sex, gestation number, maternal education, age at testing, MSEL test date, and scanner variables) between WM at age 1 and cognitive scores at ages 1 and 2 are shown for AD (b), RD (d), and FA (f). Colors represent Pearson's correlation values where brighter colors represent negative correlations and darker colors represent positive correlations; correlations that were nonsignificant after FDR correction are set to zero and shown as white [Color figure can be viewed at http://wileyonlinelibrary.com]
