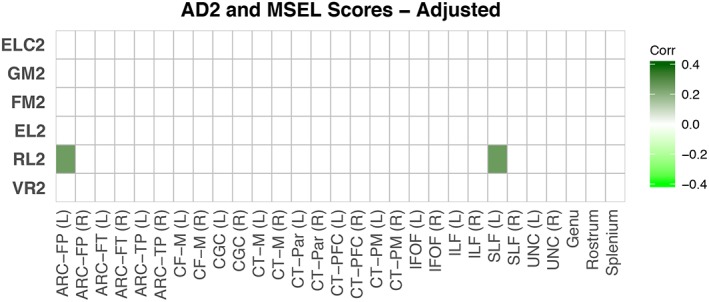
Figure 6.

Correlations between AD at age 2 and cognitive scores at age 2. Adjusted correlations (corrected for gestational age at birth, sex, gestation number, maternal education, age at testing, MSEL test date, and scanner variables) between AD at age 2 and cognitive scores age 2 are shown. Colors represent Pearson's correlation values where brighter colors represent negative correlations and darker colors represent positive correlations; correlations that were nonsignificant after FDR correction are set to zero and shown as white [Color figure can be viewed at http://wileyonlinelibrary.com]
