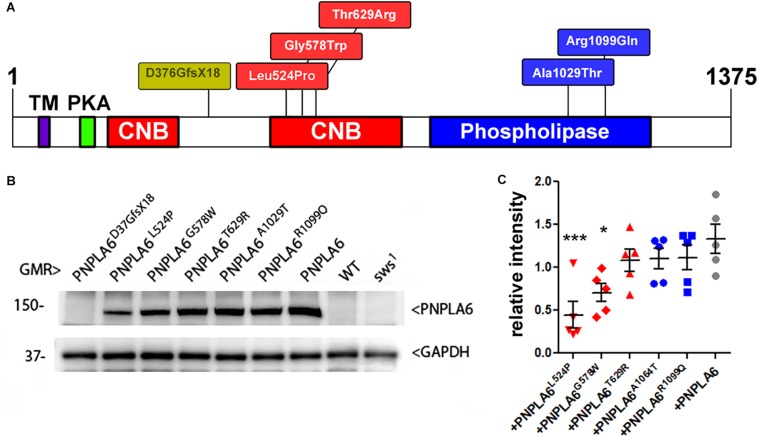
FIGURE 1.
(A) Schematic of PNPLA6 and location of the generated mutations. TM, transmembrane domain; CNB, cyclic nucleotide binding sites; PKA, domain interacting with the PKA catalytic subunit. (B) Western blot showing expression levels of the PNPLA6 proteins. Anti-GAPDH was used for a loading control. (C) A quantification from five Western blots shows a significant reduction in protein levels in PNPLA6L524P and PNPLA6G578W. Each symbol represents the value from one blot with mean and SEM indicated. ∗p < 0.05, ∗∗∗p < 0.001 compared to the mean levels of wild-type PNPLA6.

