
Figure 3.
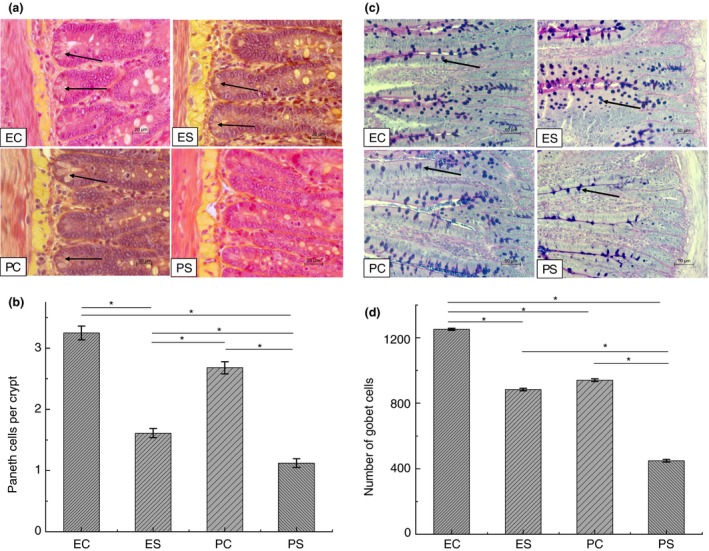
Paneth and goblet cells in the intestine of rats from different experimental groups. (a) Histological samples of the small intestine were stained with phloxine‐tartrazine to analyze Paneth cells, scale bar = 20 µm; arrows show Paneth cells; (b) number of Paneth cells, *P < 0·05; (c) Alcian blue staining of goblet cells in histological samples of the small intestine, scale bar = 50 µm; Arrows show goblet cells; (d) Goblet cells number, *P < 0·05. ES—rats were orally gavaged with Saccharomyces cerevisiae fermentate and exposed to heat stress; EC—rats were orally gavaged with Saccharomyces cerevisiae fermentate and kept at room temperature; PS—rats were orally gavaged with PBS and exposed to heat stress; PC—rats were orally gavaged with PBS and kept at room temperature. [Colour figure can be viewed at http://wileyonlinelibrary.com]