
Figure 6.
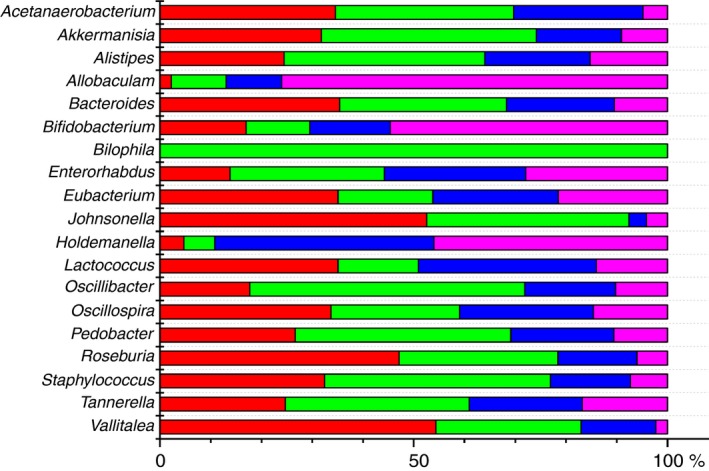
Microbial composition of the gut microbiota in different groups is presented as a per cent of abundance. ( ) ES—rats were orally gavaged with Saccharomyces cerevisiae fermentate and exposed to heat stress; (
 ) EC—rats were orally gavaged with Saccharomyces cerevisiae fermentate and kept at room temperature; (
 ) PS—rats were orally gavaged with PBS and exposed to heat stress; (
 ) PC—rats were orally gavaged with PBS and kept at room temperature. [Colour figure can be viewed at http://wileyonlinelibrary.com]