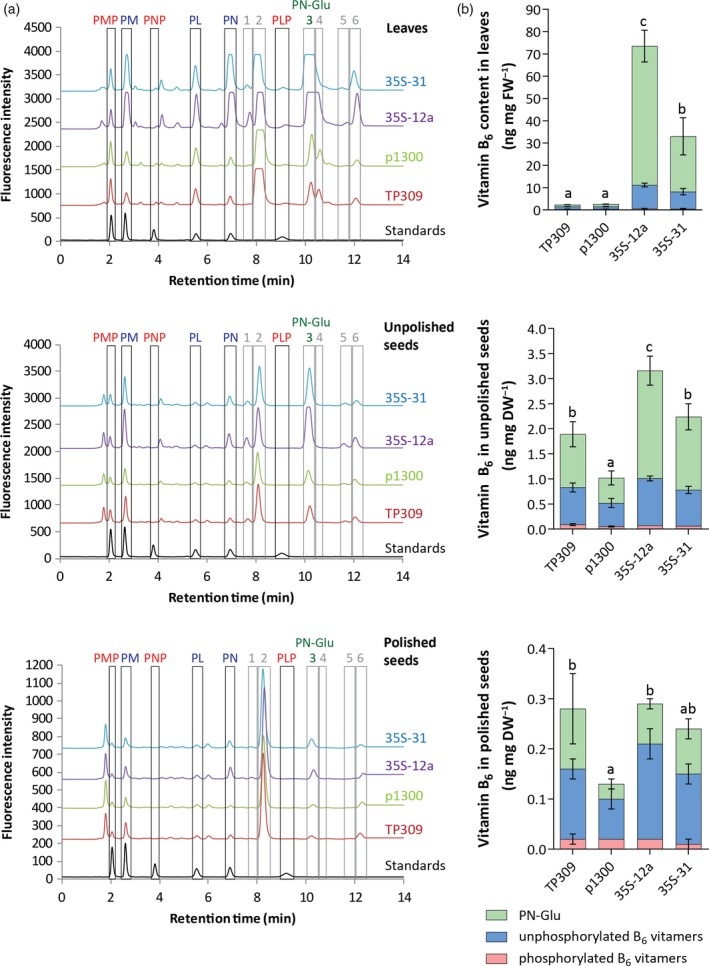
Figure 5.

Profiling of B6 vitamers in rice lines enhanced in vitamin B6 content in the T2 generation.
(a) HPLC chromatograms of leaf, unpolished seed and polished seed extracts of T2 generation plants grown in the greenhouse. Selected 35S lines are compared with the wild‐type (TP309) and empty vector control (p1300). To facilitate the visualization, the profile of TP309 was offset by 700, p1300 by 1500, 35S‐12a by 2300 and 35S‐31 by 3100, relative to the baseline for the leaf extracts; the profile of TP309 was offset by 600, p1300 by 1300, 35S‐12a by 2000 and 35S‐31 by 2800, relative to the baseline for the unpolished seed extracts; the profile of TP309 was offset by 160, p1300 by 340, 35S‐12a by 500 and 35S‐31 by 670, relative to the baseline for the polished seed extracts. Profiles for the leaf samples 35S‐12a and 35S‐31 appear saturated for PN and PN‐Glu peaks but vitamin B6 quantification was performed on diluted samples having unsaturated signals. The numbers annotate peaks that do not correspond to the standards used. Peak 3 could be assigned as glucosylated pyridoxine (PN‐Glu) based on its correlation with a corresponding increase in PN content after treatment with β‐glucosidase (see Supplementary Figure S3).
(b) Vitamin B6 content (PN‐Glu (green); unphosphorylated B6 vitamers (blue); phosphorylated B6 vitamers (pink)) in rice leaves, unpolished seeds and polished seeds according to the HPLC analysis. Average ± SD of four biological replicates. Tukey's multiple comparison test (P < 0.05) for total vitamin B6 content.
