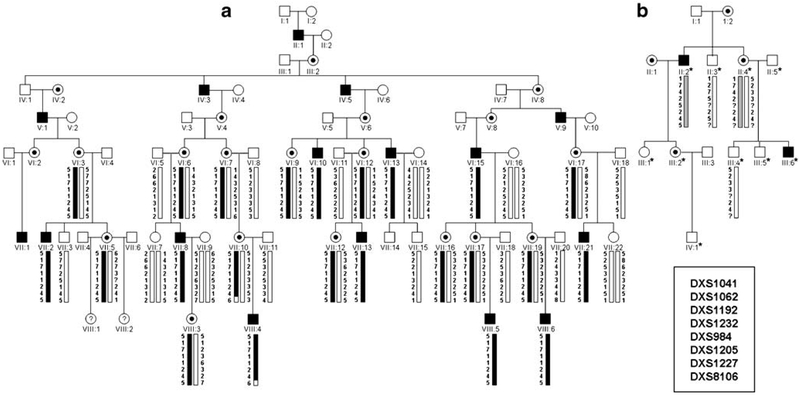
Figure 1.
Haplotype analysis for families CMT193-ext (a) and US Ped2 (b) for markers spanning the CMTX3 locus. Males are represented by squares, females as circles. Blackened squares and black dots represent affected males and female carriers, respectively. Haplotypes were constructed using the genotype information of microsatellite markers ordered centromere (top) to telomere (bottom). The shared haplotype segregating with the disease in CMT193-ext and US Ped2 are marked with black and gray bars, respectively. The asterisk denotes individuals from US Ped2 that were genotyped in the original study by Ionasescu et al. [6]. For this study, DNA samples from four individuals were available for genotyping.

