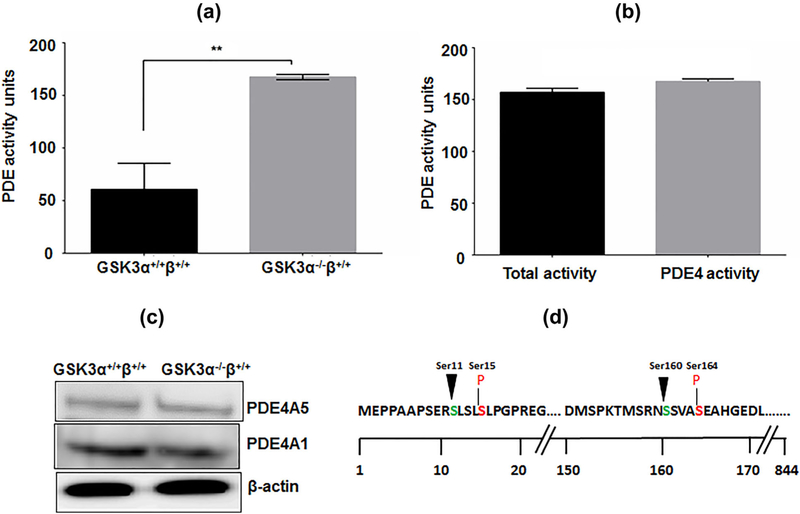
FIGURE 3.
Verification of involvement of PDE4 for reduced cAMP titer in GSK3α knockout mice spermatozoa. (a) Comparison of profile of PDE4 activity in GSK3α+/+β+/+and GSK3α−/−β+/+ mice sperm cells. (b) Comparison of profile of total PDE activity and PDE4 activity in GSK3α−/−β+/+ mice sperm cells. Incubation was done at 30 °C for 30 min. Data represent mean ± SEM of at least n = 3 for all the values. **p ≤ 0.01, versus GSK3α+/+β+/+ values. (c) Comparison of levels of different PDE4 isoforms in whole cell lysates of GSK3α+/+β+/+and GSK3α−/ −β+/+ mice sperm cells. (d) Consensus sequence for GSK3 phosphorylating sites on PDE4A; arrow indicates Ser residue to be phosphorylated by GSK3 (nth residue), while n+ 4th pre-phosphorylated Ser residue is indicated in red

