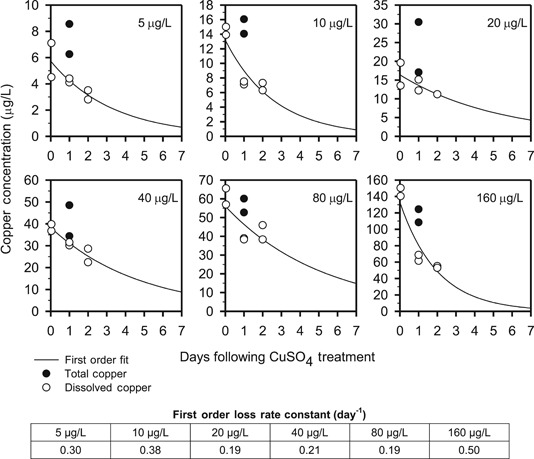
Figure 2.

Time series of measured total (closed circles) and dissolved (less than 0.45 µm, open circles) copper in microcosms at various nominal copper concentrations. Plotted data are the arithmetic average of measurements from duplicate microcosms. The solid line is a first‐order loss (i.e., C = C 0 exp[–kt]) fit through the dissolved copper data.
