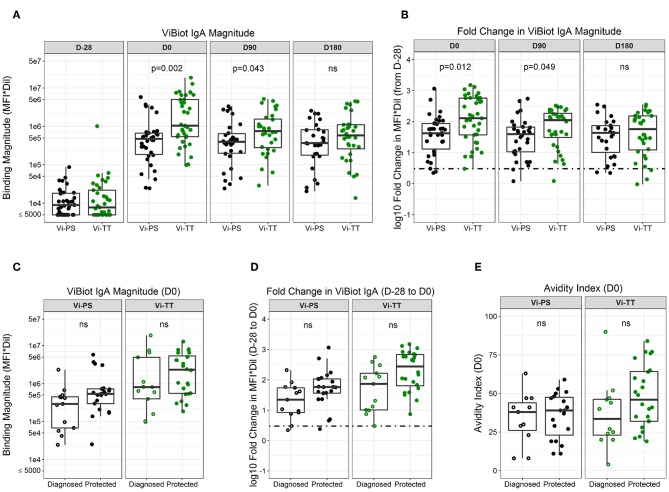
Figure 2.
ViBIOT-specific total IgA magnitude, fold change, and avidity higher in protected individuals of both vaccine groups. ViBIOT-specific IgA magnitude (A) and fold change (B) by vaccine group over time. ViBIOT-specific IgA magnitude (C) and fold change (D) by diagnosed/protected outcome at day of challenge. ViBIOT IgA avidity index (E) by diagnosed/protected outcome at day of challenge. Diagnosed and protected individuals are represented by open and closed circles, respectively. Data points are representative of n = 2 independent experiments (each with n = 2 technical replicates). n.s indicates non-significant FDR-corrected p values.

