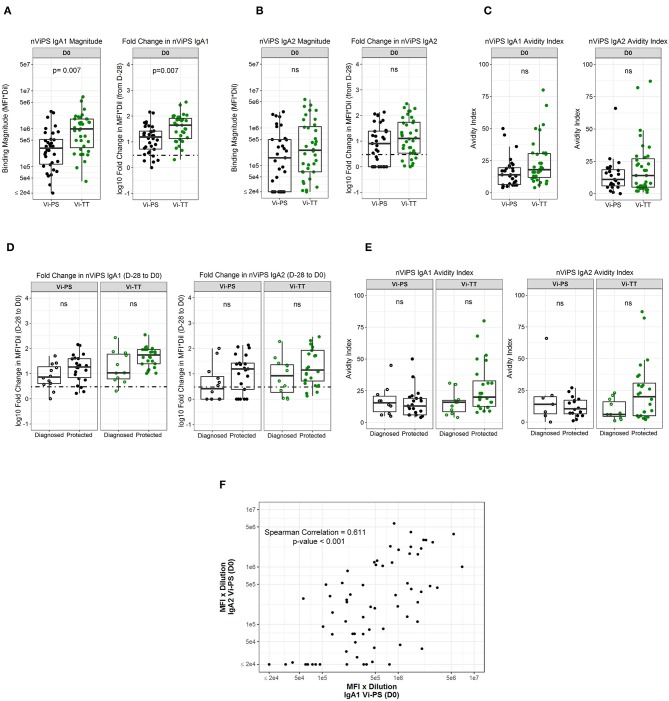
Figure 4.
nViPS IgA1 and IgA2 fold change higher in protected individuals in both vaccine groups. nViPS-specific IgA1 magnitude and fold change (A) and nViPS-specific IgA2 magnitude and fold change (B) by vaccine group from baseline to day of challenge. nViPS IgA1 and IgA2 avidity index (C) by vaccine group at day of challenge. IgA1 and IgA2 fold change from baseline to day of challenge by protected/diagnosed status (D) and IgA1 and IgA2 avidity index at day of challenge (E) by protected/diagnosed status. Data points are representative of n = 2 independent experiments (each with n = 2 technical replicates). Spearman correlation between nViPS IgA1 and IgA2 magnitude (F) at day of challenge. n.s indicates non-significant FDR-corrected p values.

