Fig. 2.

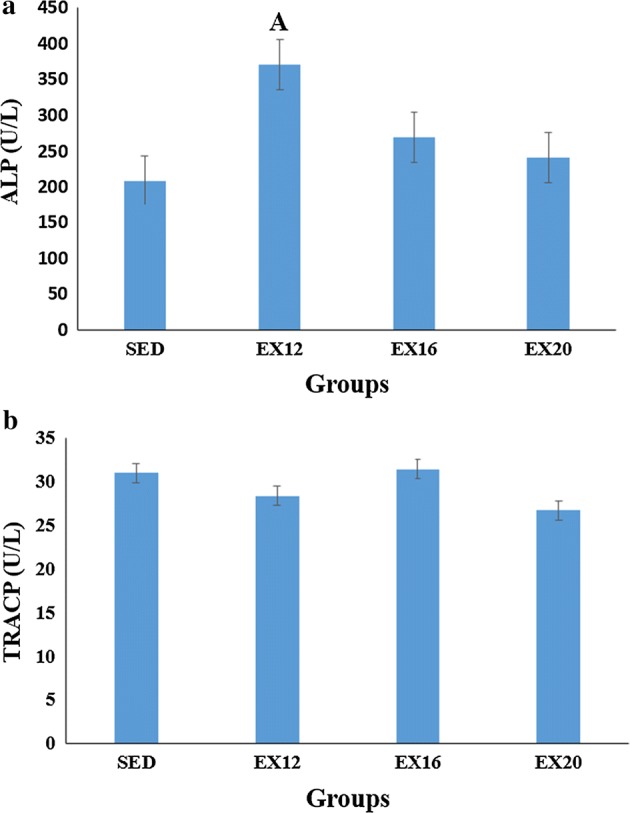
The concentrations of ALP and TRACP obtained from serum analysis. The error line represents SD. a ALP Alkaline phosphatase. b TRACP Tartrate-resistant acid phosphatase. A Statistically different from SED group (p < 0.05)

The concentrations of ALP and TRACP obtained from serum analysis. The error line represents SD. a ALP Alkaline phosphatase. b TRACP Tartrate-resistant acid phosphatase. A Statistically different from SED group (p < 0.05)