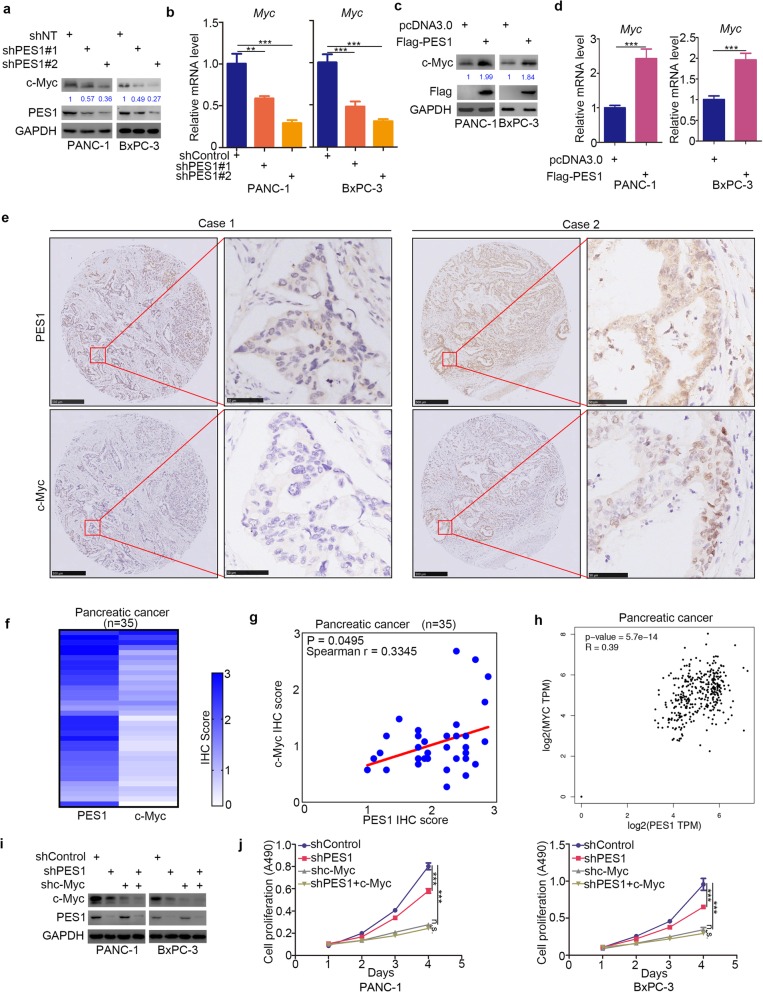
Fig. 4.
PES1 up-regulates c-Myc in pancreatic cancer cells. a and b, pancreatic cancer cells (PANC-1 and BxPC-3) were infected with indicated shRNA. After 72 h, cells were harvested for Western Blotting analysis (a) and RT-qPCR analysis (b). Data shown is in the form of Means ± SD (n = 3). **, P < 0.01; ***, P < 0.001. c and d, PANC-1 and BxPC-3 cells were transfected with indicated plasmids. After 24 h, cells were harvested for Western Blotting analysis (c) and RT-qPCR analysis (d). Data shown is in the form of Means ± SD (n = 3). ***, P < 0.001. e-g, the tissue microarray of pancreatic cancer (n = 35) was stained with PES1 and c-Myc respectively. The typical image of PES1 and c-Myc was shown in (e), the IHC scores of PES1 and c-Myc was shown in (f) and the correlation of these two proteins was shown in (g) (Spearman r = 0.3345, P = 0.0495). h, the mRNA expression level of PES1 and Myc were presented in (h) by using the GEPIA web tools (Spearman r = 0.39, P values as indicated). i and j, pancreatic cancer cell lines were infected with indicated plasmids. 72 h post-infection, cells were harvested for Western Blotting analysis and MTS assay (n = 3). Data presented as Means ± SD. N.s., not significant; ***, P < 0.001

